
A minimum in the 2022 Antarctic sea-ice extent was reached on February 18 with an ice coverage of 2.17 million km²(*), making this a new all-time record-low sea-ice extent since the start of the satellite observations. It is more than 3% lower than the previous record-low in 2017 (2.24 mill km²).
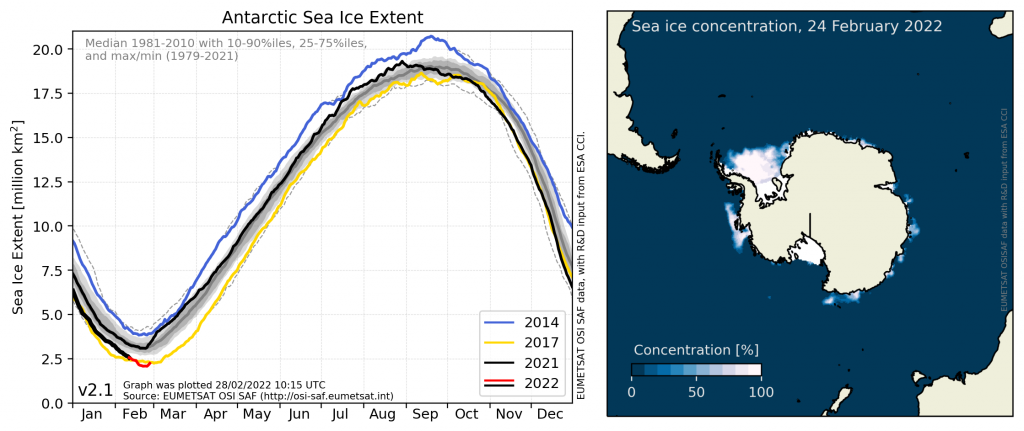
Figure 1: [Left] The daily sea-ice extent values from the previous and current year (black), plus the reference curves for 2014 and 2017, which were the two years with the highest and lowest ice extents ever recorded with satellite monitoring in the Antarctic. Note, that the present year 2022 combines a black and a red line which represents the slightly different retrieval methods behind the data. The black covers the Interim Climate Data Record data, and the red is the supplementing near-real-time data. Grey shows the median of the 30-year climate reference period, 1981-2010, and the grey dashed lines mark the record-high and record-low daily values throughout the year for the full record, 1979-2021. [Right] The Antarctic sea-ice concentration on February 24, 2022.
After having reached some of the highest values in July and August 2021, the Antarctic sea-ice extent has been tracking low values after November. Beginning of 2022, the extent continued being low, and since mid-February, the extent dropped below the lowest daily extent values. The table below shows the top 5 lowest and 5 highest minima of sea-ice extent recorded in the Antarctic, and at what day they occurred:
|
Top 5 lowest Antarctic minima |
Top 5 highest Antarctic minima |
|---|---|
|
2022-02-18 2.17 million km2 2017-03-01 2.24 million km2 2018-02-19 2.33 million km2 1997-02-26 2.48 million km2 2011-02-21 2.52 million km2 |
2008-02-19 4.09 million km2 2013-02-19 3.91 million km2 2015-02-22 3.87 million km2 2003-02-19 3.84 million km2 2014-02-18 3.83 million km2 |
Despite the new significant record-low of the Antarctic sea ice it is still difficult to conclude anything about its long-term- and future trend. Before 2015, the Antarctic sea ice exhibited a slightly increasing trend over decades and reached record-high coverage in 2014 (or 2015 depending on the months considered). Thereafter, an abrupt change led to record-low values in 2017 and hereby resulted in some of the largest interannual variability observed in the sea ice cover. Large interannual variabilities have continued since then and no clear trend has been observed. See this rank figure to see the Antarctic sea-ice trends back in time.
In terms of monthly averaged values, February 2022 becomes the second-lowest on record, after 2017. The long-term trend for February is for the first time slightly negative (not statistically significant), see figure below.
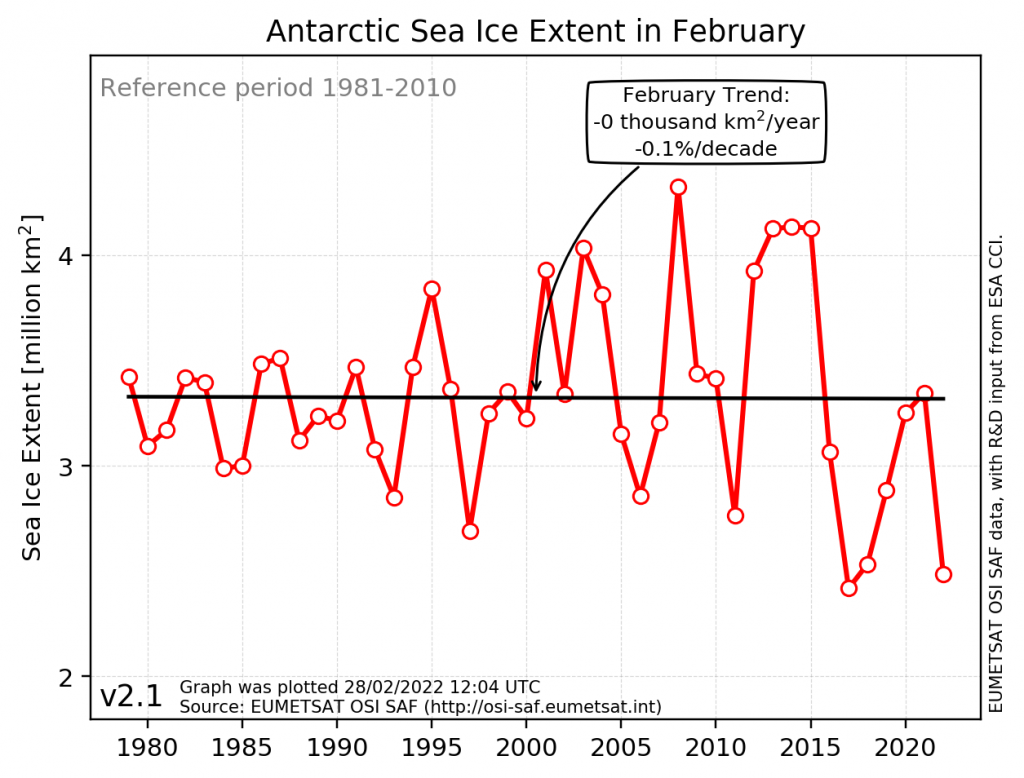
Figure 2: Time series of monthly Antarctic sea-ice extent for February. The black line represents the trend line based on the reference period 1981-2010.
The Antarctic sea ice covers vast ocean areas, and the sea ice in different regions may behave independently from each other. Thus, a record-low Antarctic sea-ice extent does not need to be applicable for the individual regional ice extents. Below, is shown the map of February 2022 sea-ice concentration and its anomaly from the climate reference period 1981-2010. The larger loss of sea ice in 2022 is seen to be concentrated in especially the Ross Sea, toward the Amundsen Sea, and in the outer part of the Weddell sea ice cover.
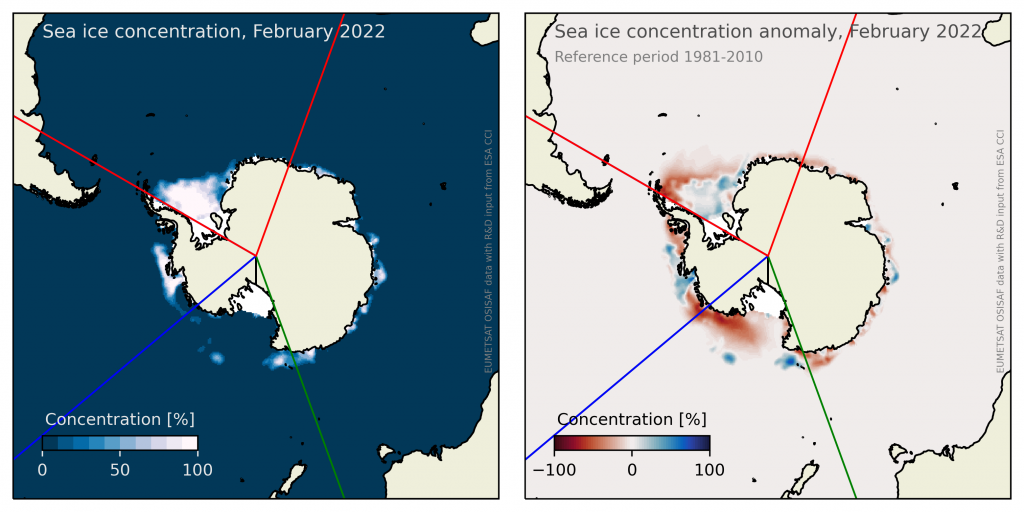
Figure 3: The Antarctic monthly sea-ice condition for February 2022. [Left] February sea-ice concentration. [Right] Sea-ice concentration anomaly for February 2022 relative to 1981-2010. The sector between red lines is the Weddell Sea, between blue and red lines is the Bellingshausen and Amundsen seas, and between green and blue lines is the Ross Sea.
The daily sea-ice extent is computed for the three sectors marked in Figure 3; the Weddell Sea, Bellingshausen and Amundsen seas, and the Ross Sea. The ice extent indices are shown below together with the total Antarctic sea-ice extent.
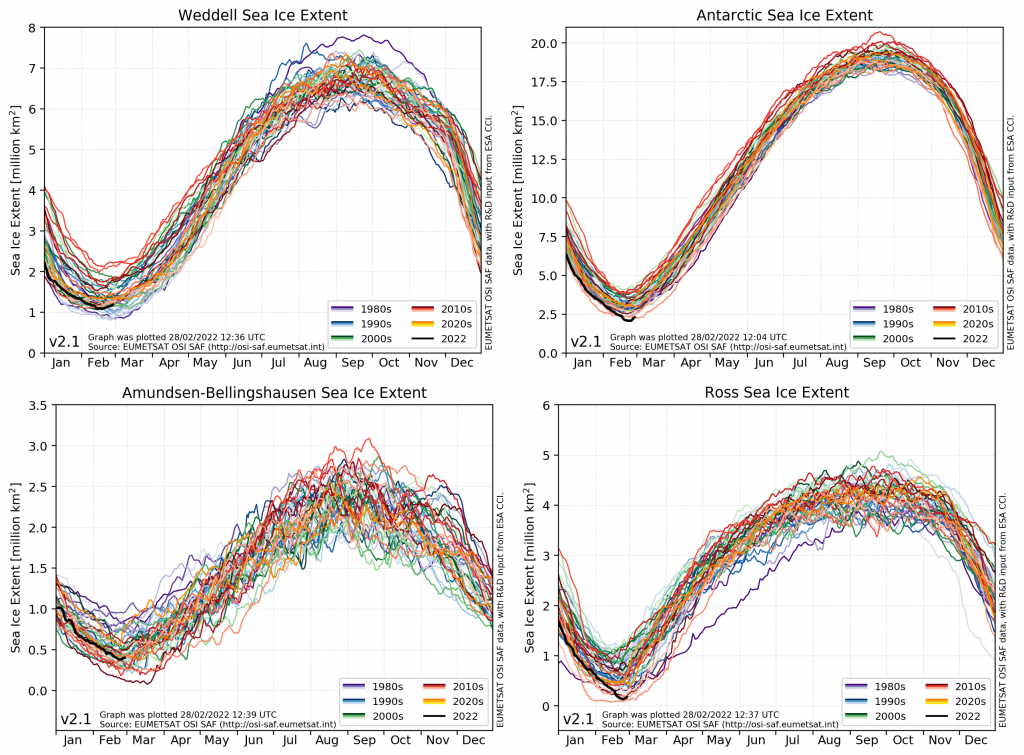
Figure 4: Daily sea-ice extent values from the current year (black), and all available years since 1979. The line colour represents the individual year. The colours are selected so that the years are grouped into decades. [Upper-left] Weddell Sea, [upper-right] entire Antarctic ocean, [lower-left] Bellingshausen and Amundsen seas, and [lower-right] Ross Sea. See the location of regional seas in Figure 3.
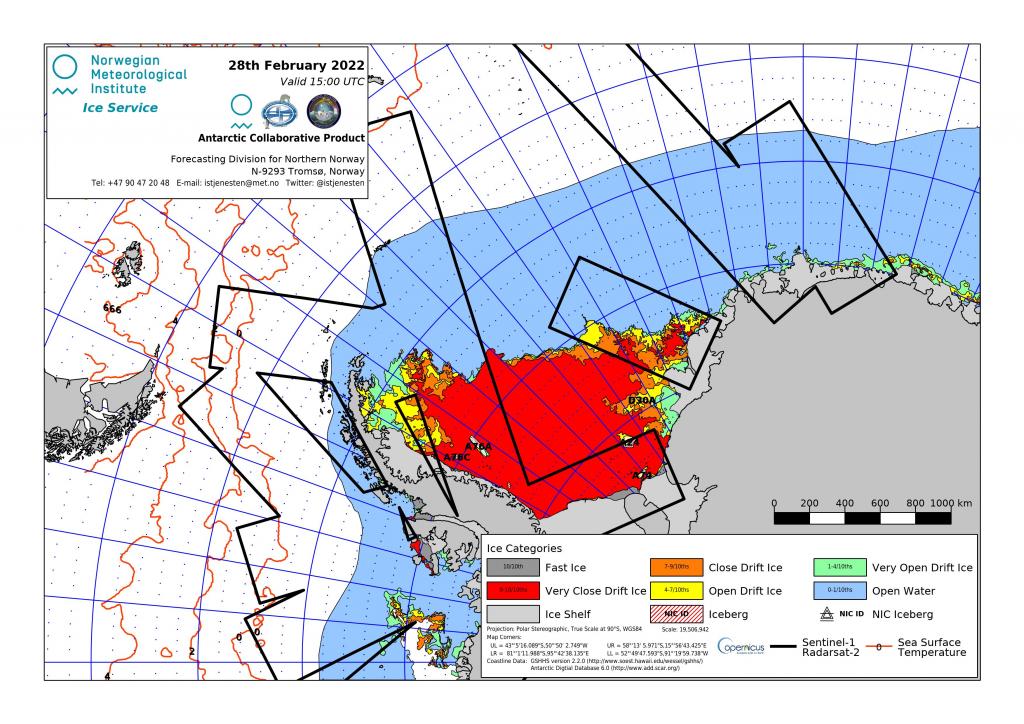
Note, that MET Norway also provides weekly navigational ice charts in the Antarctic summer period. Below is shown the ice chart from the Weddell Sea from February 28. More ice charts are found here.
__________________________
* When this story was first published on February 28, the day of minimum sea-ice extent in the Antarctic was registered to February 24 with a coverage of 2.07 million km2. This conclusion was based on the near-real-time estimates that supplement the climate data record within the recent 16 days corresponding to the latency of the climate data record. Now that the climate data record is updated for this period, the minimum sea ice is slightly modified to February 18 with a coverage of 2.17 million km2. Note, that the near-real-time estimates are often visualized with a red extension of the present year's black line in our ice extent plots.