
In late May, 60% of the Norwegian mainland is still covered by snow. This is much more than what has been the case for 2016 - 2019. At this time last year 30% of Norway was snow-covered, while the warm spring two years ago led to a total snow cover of 10% at the end of May 2018.
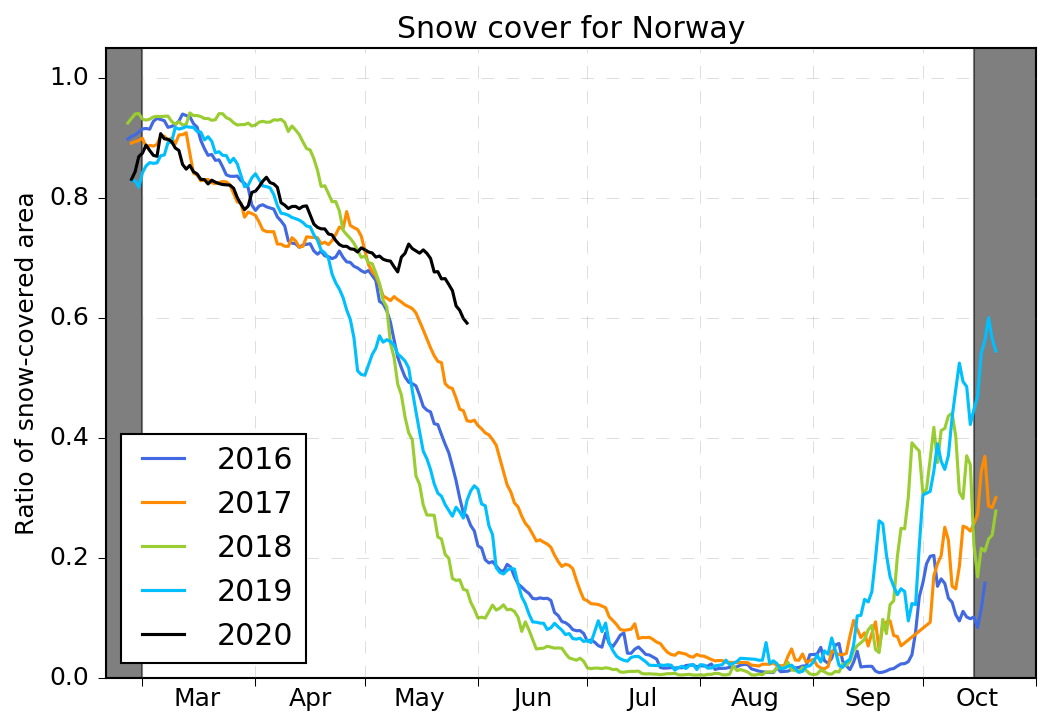
The figure above shows the ratio of snow-covered area for mainland Norway from 2016 up until May 28 2020. Each year is represented by a separate color. The data are drawn from daily snow cover maps generated from satellite measurements by optical instruments. To derive snow cover from this type of instrument the Sun must be above a certain elevation during satellite overpass. These snow cover maps are therefore not available during winter. This is indicated by the grey areas in the figure.
 |
 |
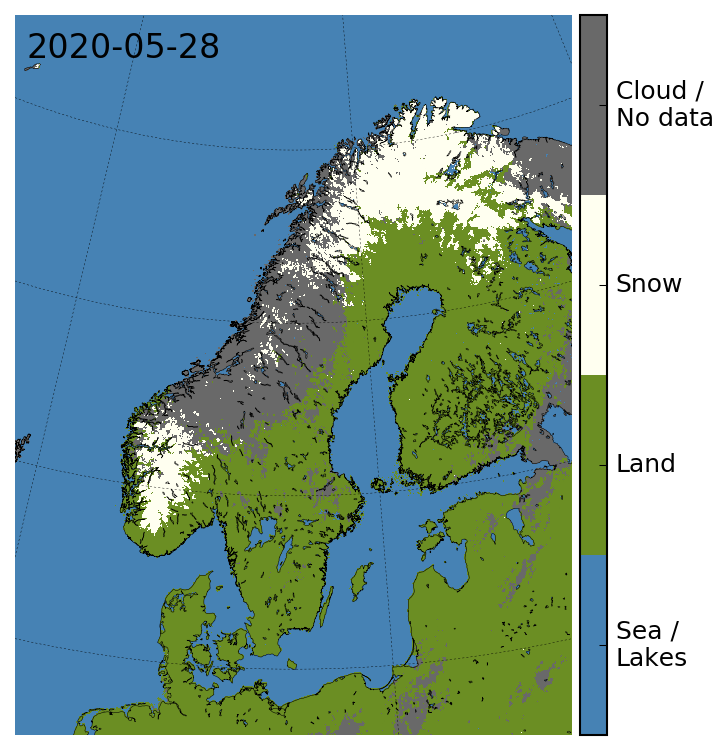
The figure above left shows the snow cover map for May 28 2020. The optical satellite instrument cannot see through clouds. For most days some parts of Norway will be cloud-covered. To be able to estimate the ratio of snow-covered area, cloud-free mosaics are made, which means that for areas that are cloud-covered in today's map it is searched backwards in time to the most recent cloud-free observation. The map on the right shows the cloud-free mosaic for May 28 2020.
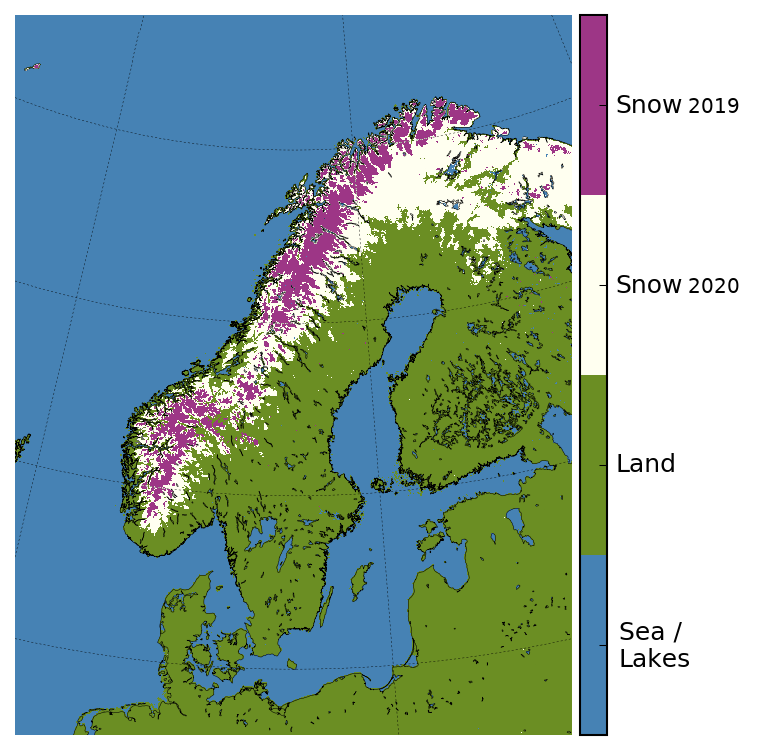
Here, the snow cover for May 28 2019 is shown in pink and plotted on top of the snow cover for May 28 2020 (shown in white). Both in the northern and southern parts of Norway, the snow-covered area is much larger this year compared to the same time last year.
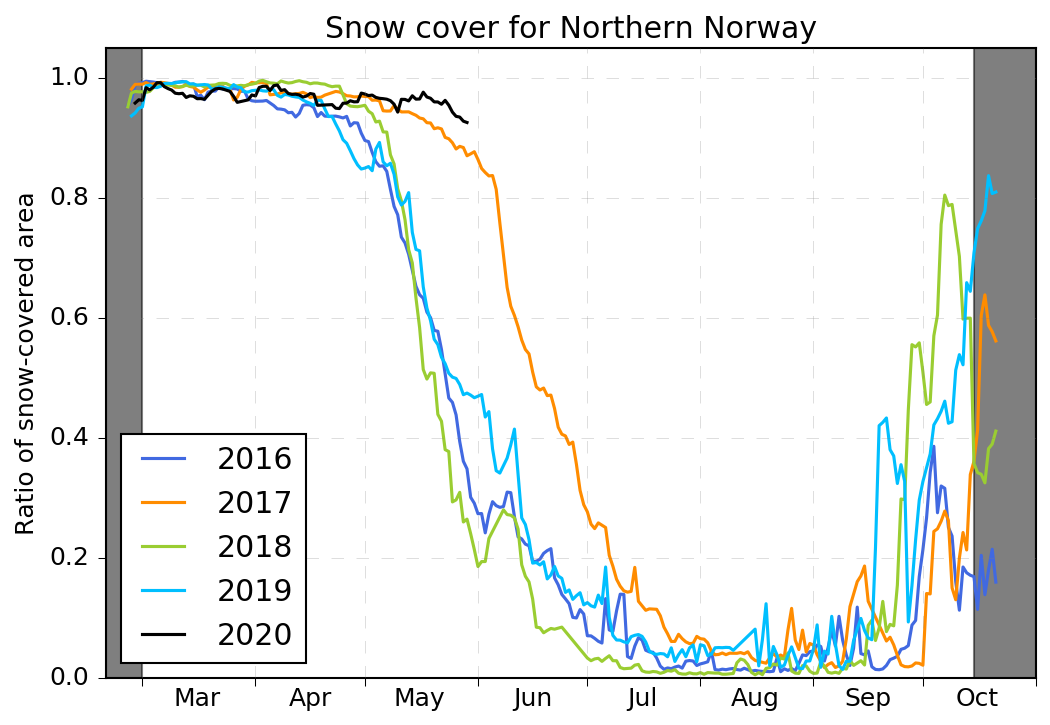
If we focus on Northern Norway (Nordland, Troms and Finnmark) the situation is illustrated by the figure below. More than 90% of Northern Norway was still snow-covered on May 28 2020. This is not very different from 2017 which also had a high ratio of snow-covered area for this time of year. The years 2016, 2018 and 2019 on the other hand, had far less snow cover at the end of May.
The figure below shows the ratio of snow-covered area for Southern Norway as of May 28 2020. Up until early/mid-April 2020 was not much different from other recent years (in terms of snow cover, that is). During the first half of May, however, the melting process toward a snow-free ground has been significantly slower than for previous years.
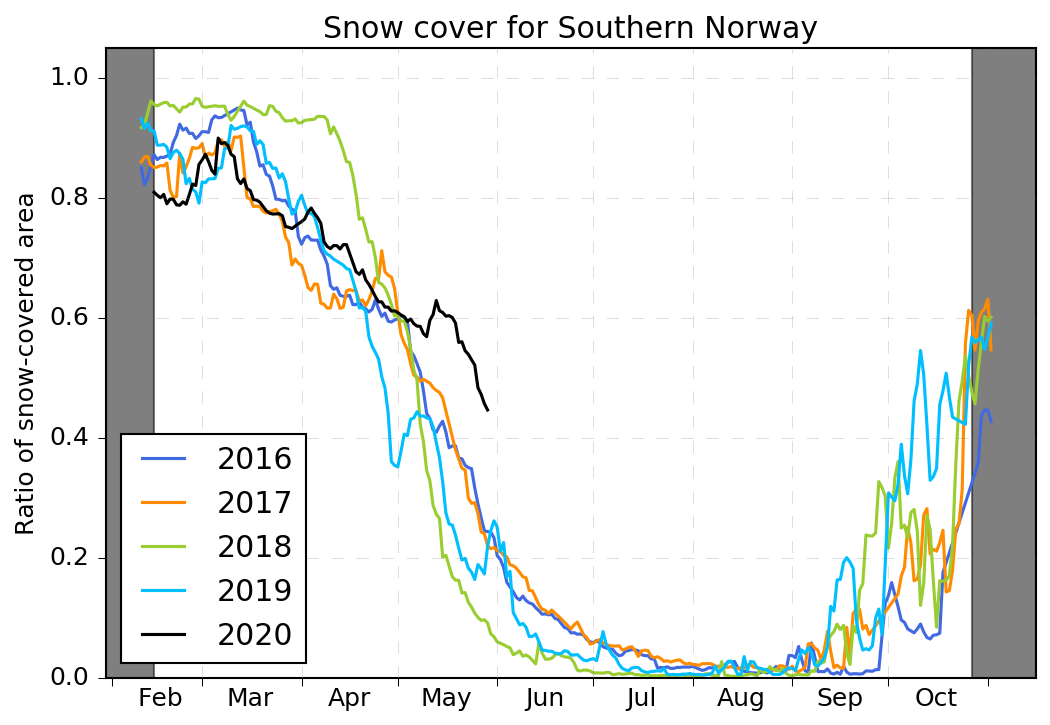
Note that these graphs do not say anything about snow depth, only the ratio of snow-covered area. Large parts of the country have had above-normal amounts of snow this winter, and it will naturally take longer before the ground is free of snow. The figure below shows 4 examples of meteorological observation stations that have had high amounts of snow this winter, compared to previous years.
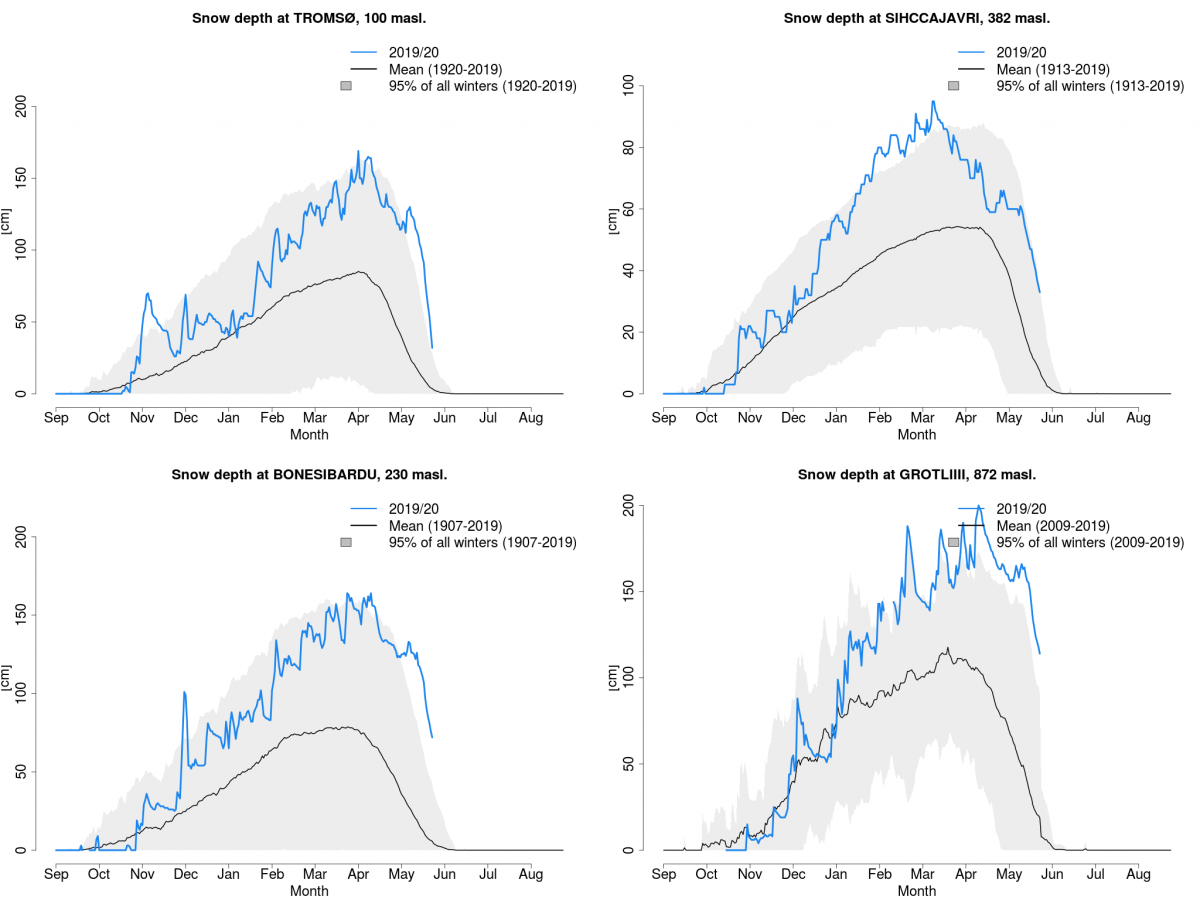
In these figures, the blue line shows this winter’s observed snow depth, while the grey line shows the average snow depth for previously observed winters. The light grey area shows where 95% of the snow depth observations have been found. 3 of the examples shown are from stations in Troms and Finnmark, while the station Grotli is situated further south in Innlandet county. Observed snow depths for a number of locations in Norway can be found here. The snow cover maps and the figures for ratio of snow-covered area are also updated daily on cryo.met.no.