
We’re pleased to announce the availability of our visualisations from a number of short-range sea ice forecasts for the Greenland Sea and Fram Strait. These provide maps of estimated sea ice concentration, thickness, and drift at 24 forecast intervals, and animations for the whole forecast period, up to 6 days ahead. The new page also provides a comparison of the forecasts for predicted distance and direction of the sea ice edge from near Jan Mayen island.
This information should be considered demonstration or experimental.
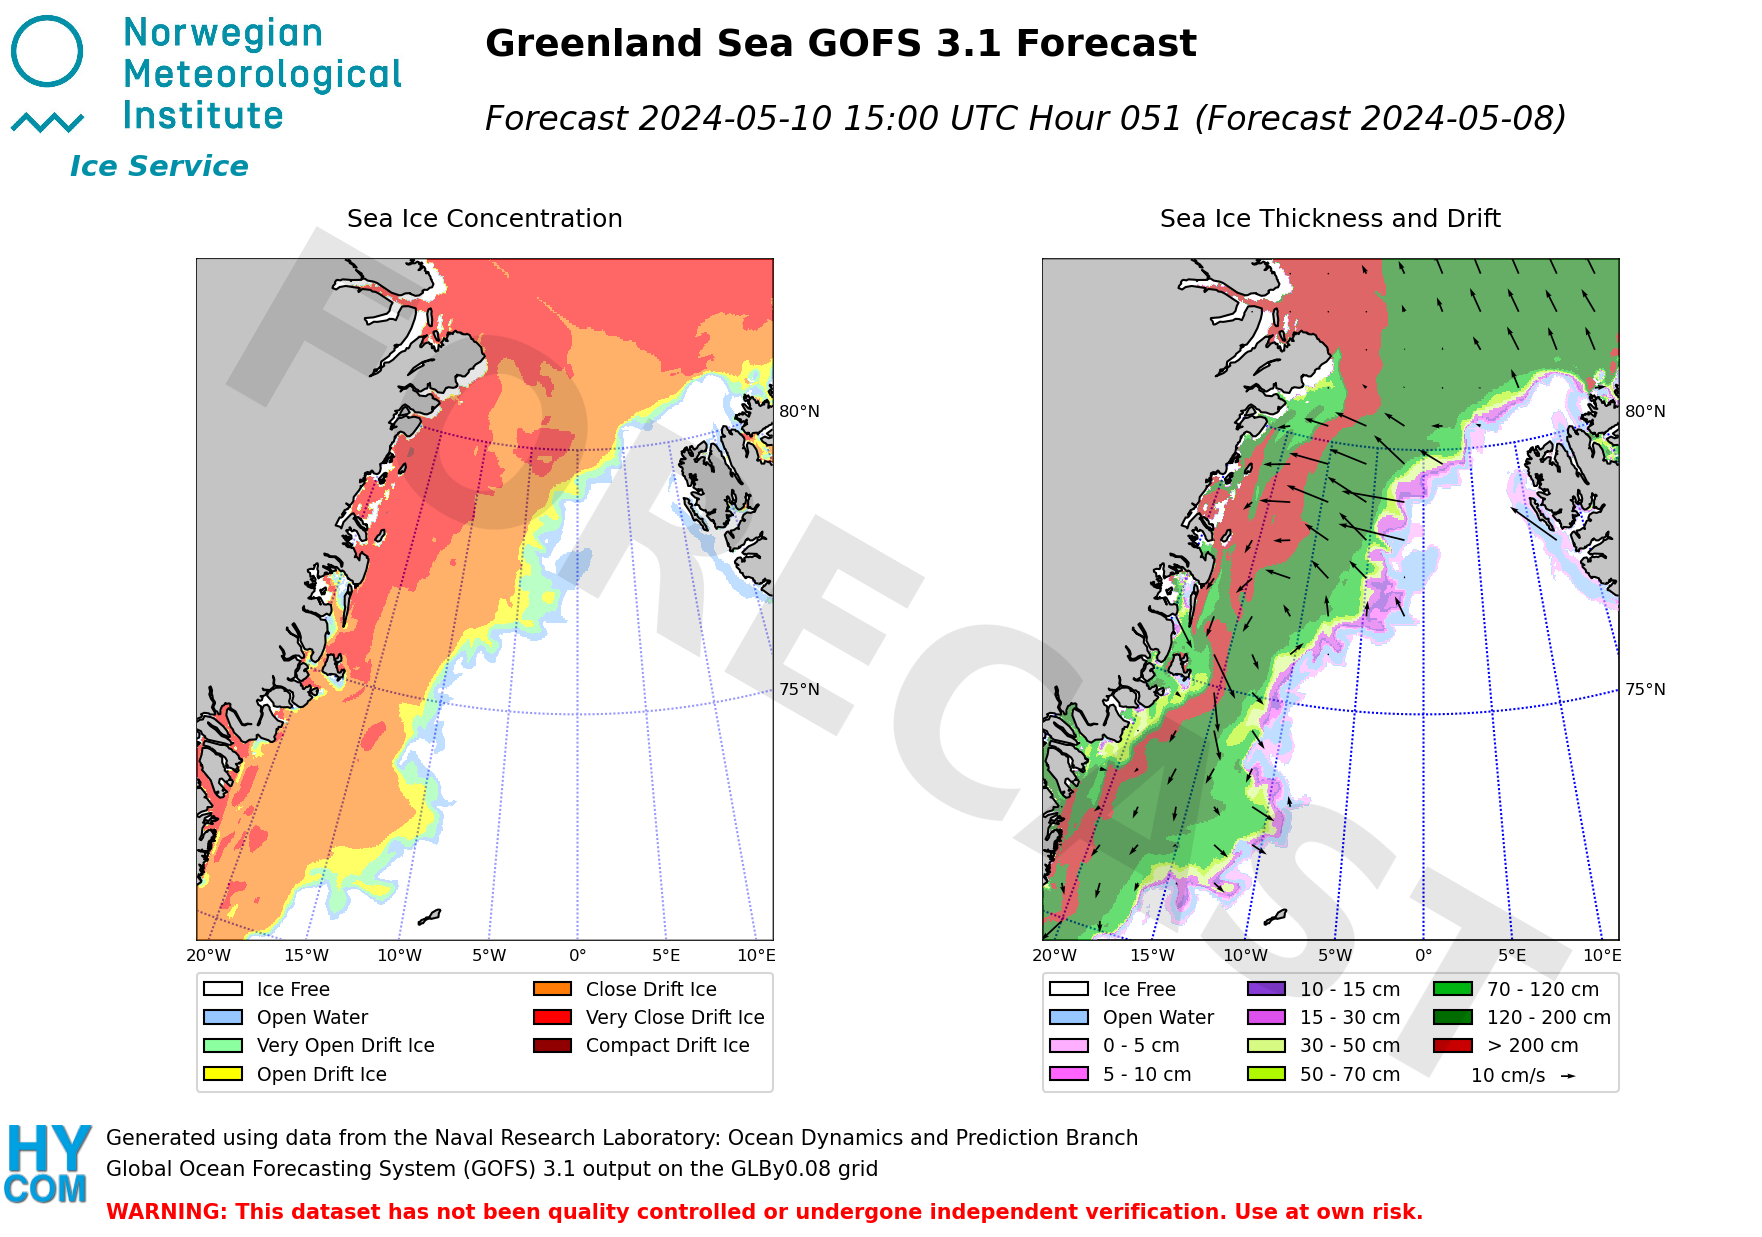
The forecasts come from 3 forecast models:
- The Global Ocean Forecasting System (GOFS) 3.1 forecast is produced by the Naval Research Laboratory: Ocean Dynamics and Prediction Branch and provides a 180-hour forecast on a global grid that is 0.08° longitude by 0.04° latitude. This equates to a 2 by 4 km grid at 80°.
- The neXtSIM (ARCTIC_ANALYSISFORECAST_PHY_ICE_002_011) forecast is produced by the Copernicus Marine Service (CMEMS) and provides a 168-hour forecast over a 3 by 3 km grid covering the Arctic, but excluding the Canadian Archipelago, Baffin Bay and Hudson Bay.
- The Barents-2.5km forecast is produced by the Ocean and Ice section of the Research and Development department of MET Norway and provides a 66-hour forecast for the Barents, Norwegian and Greenland Seas.
More information and the maps can be found on https://cryo.met.no/en/short-range-sea-ice-forecasts.