
Børge Ousland and Mike Horn’s 87 day expedition to cross the Arctic Ocean via the North Pole on skis, from boat to boat without assistance, took place during changing sea ice conditions. Using sea ice drift products - retrieved daily from satellite data - we can estimate the influence ice drift had on the expedition. Ousland and Horn started the expedition in September as the Arctic sea ice was at its yearly minimum extent, and as they progressed into the Polar night the ice extent increased due to freezing of the sea surface. The sea ice freezes throughout winter, but is also in continuous movement and drift, influenced by wind in particular but also by ocean currents. On average the polar ice moves in roughly the same direction as the planned expedition route: from the Siberian side, across the Arctic Ocean and out through the Fram Strait. This drift is called the Transpolar Drift (see figure 1).
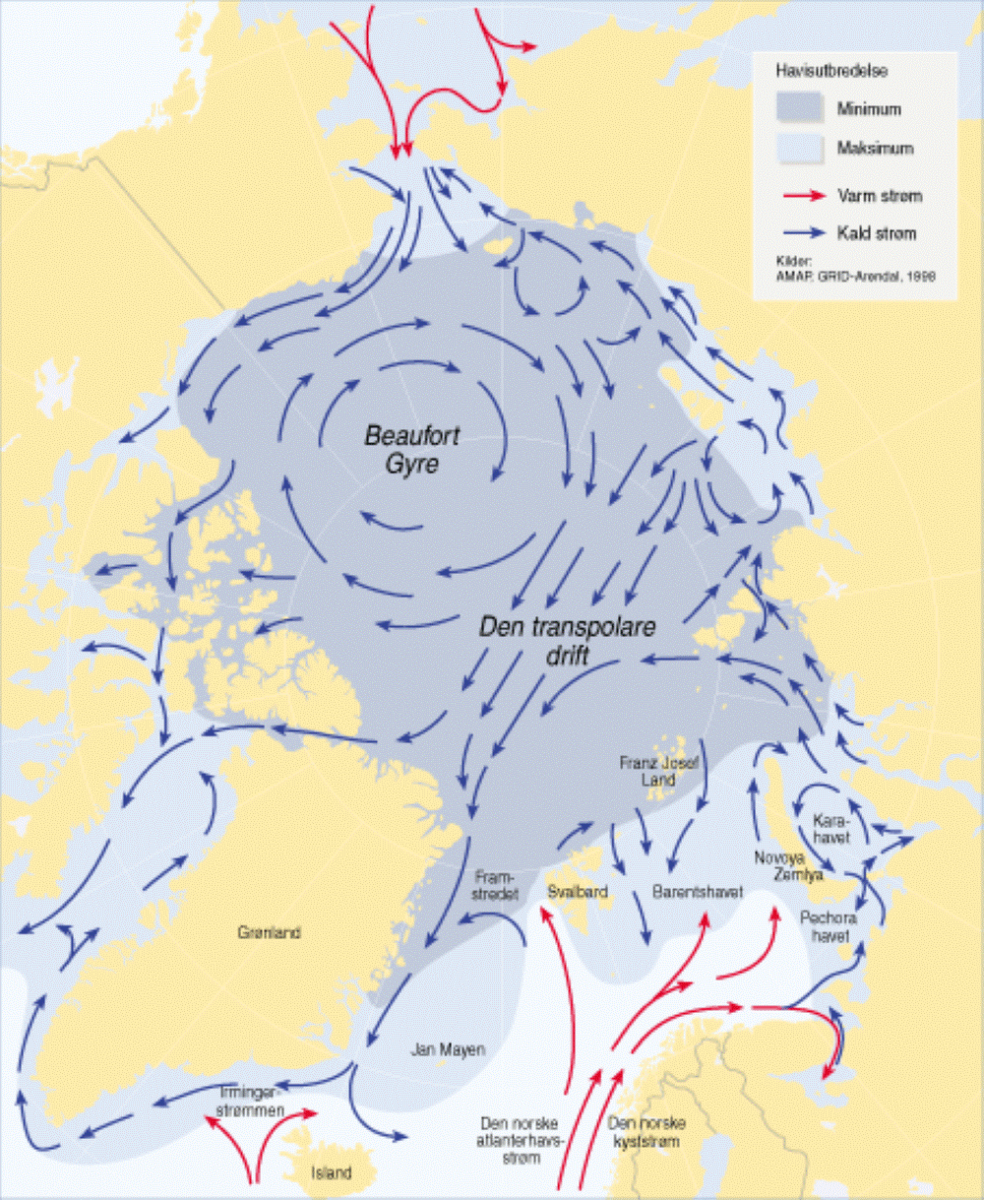
Figure 2 (right) shows the route across the Arctic Ocean, but the length of this route is not necessarily equal to the distance they have actually moved. This is because they are skiing on top of an ice surface in constant movement. When the ice drift coincides with the direction the polar explorer wants to progress they are helped by the sea ice drift. When the ice drifts in the opposite direction they have to walk a longer distance than the actual progress they make. When the ice drifts westward, the explorers have to move more eastwards to maintain a North-South direction. By accounting for ice drift for every day of the expedition we can estimate the influence from ice drift compared to the distance they have moved by their own efforts. For each day three distances are computed:
-
the daily, total distance based on the coordinates
-
the daily distance the ice has drifted
-
the daily distance the explorers have skied
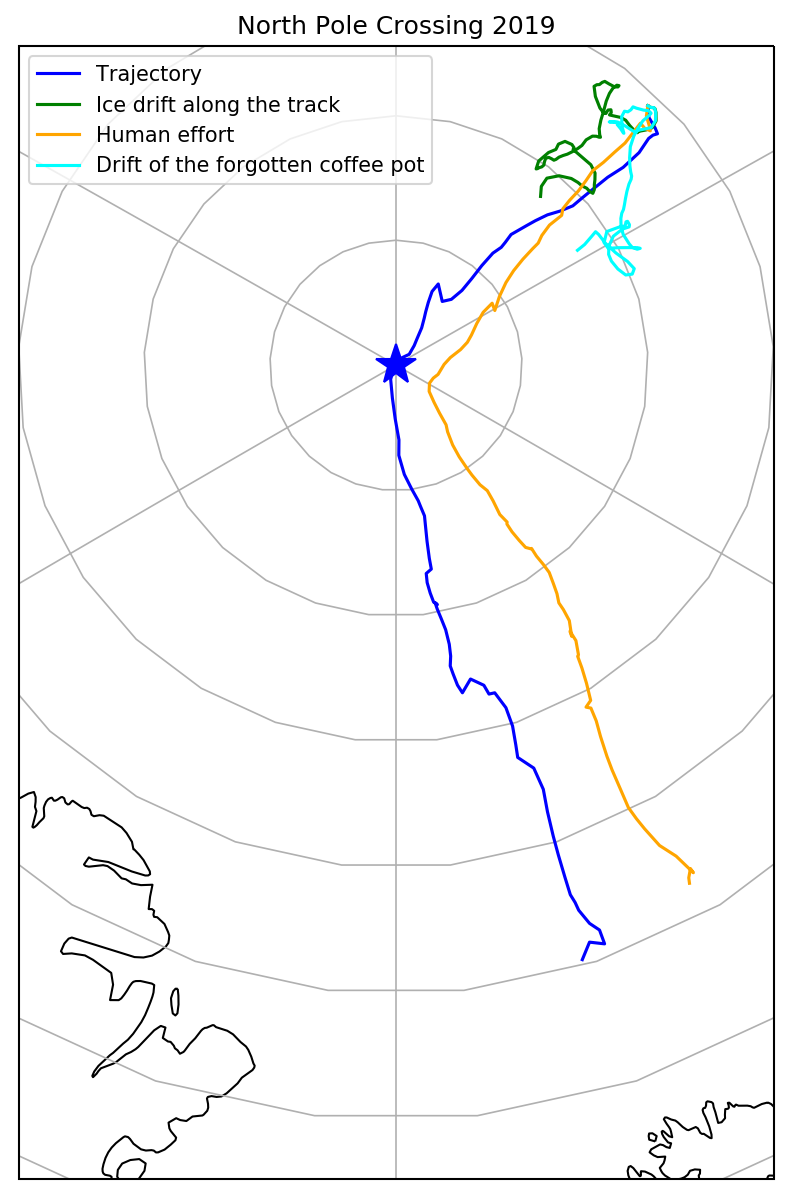
The animation in Figure 2 (left) shows these three distances summarized in the form of 10 day legs. The blue line corresponds to the geographical movement of Ousland and Horn (distance 1 above). The contribution from ice drift during the course of the same 10 day intervals is shown in green (distance 2). The yellow line shows the effort expended by the explorers, that is the route they would have followed had the ice not drifted.
From the animation we can see that en route to the North Pole Ousland and Horn had to actively adjust their heading more to the west due to ice drift towards the east. Going south from the North Pole they experienced ice drift towards the west, and had to adjust their heading more eastwards to maintain course towards the location of their planned pick up.
Using this approach we can estimate that Ousland and Horn have moved a distance of approximately 1500 km. During the same time period they have drifted some 600 km with the sea ice, and they have skied approximately 1300 km.
The figure below shows a summary of the expedition. The blue line shows the total trajectory, the green line shows the ice drift along the track, and the yellow line shows the total daily human effort. For comparison we show the trajectory of a hypothetical coffee pot that was left on the ice on day one of the expedition (light blue line). The coffee pot would have drifted with the ice. The ice is dynamic, and the ice drift depends on the location. The fact that the green and light blue trajectories differ illustrates this.
You are welcome to browse, download and use MET Norway’s open sea ice drift data. Visit this link.