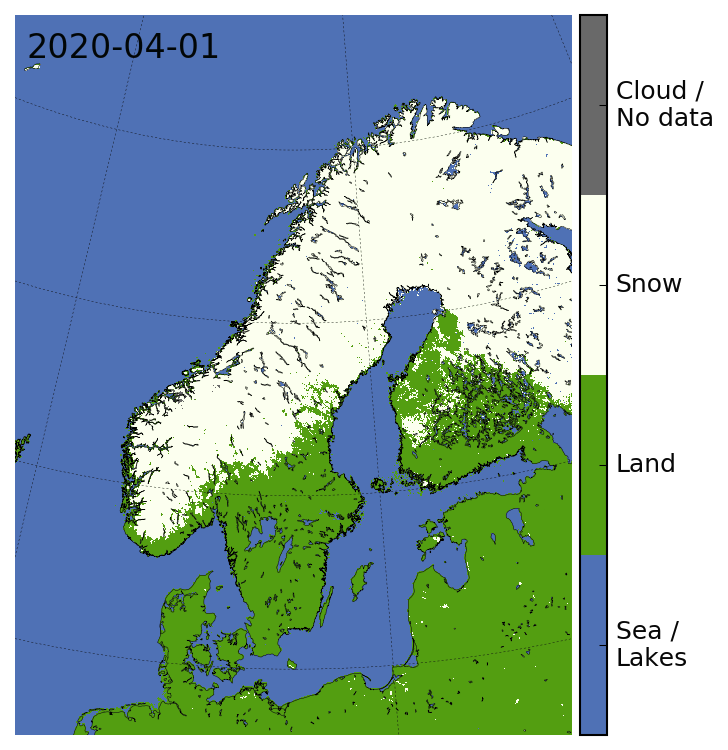
While parts of southern Norway are welcoming a greener spring, many places in Norway are still covered in large amounts of snow. The map below shows the status of the snow cover in Norway on 1 April, observed with satellite sensors. Such maps are produced daily by the Norwegian Meteorological Institute and can be viewed here.
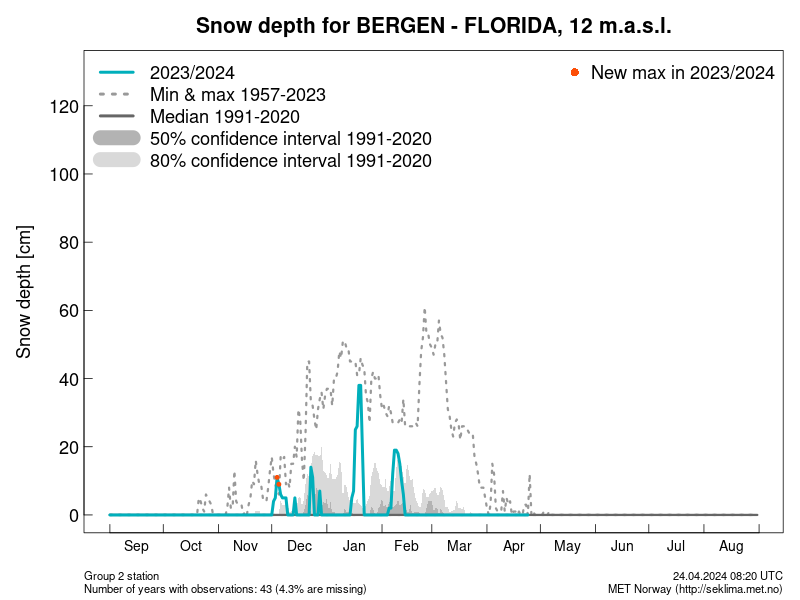
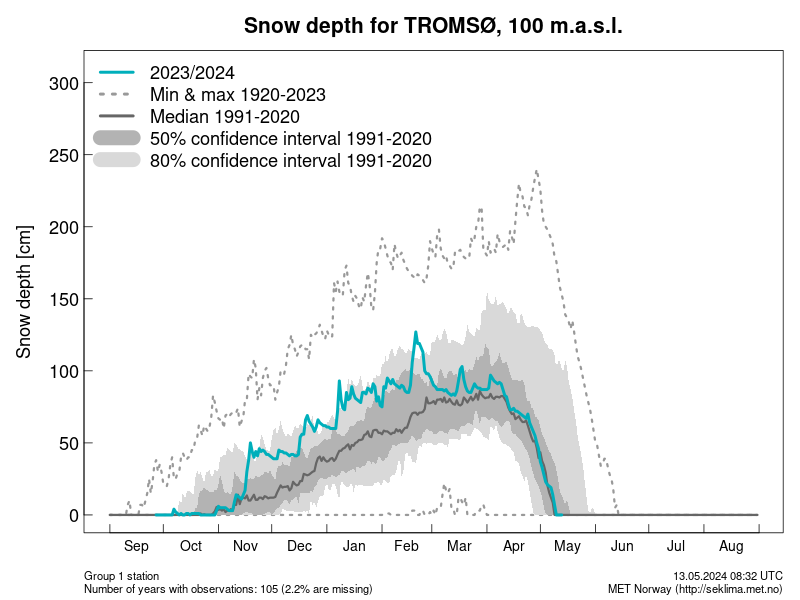
There have been major regional differences in the amount of snowfall in Norway this winter. This can be seen from ground observations of snow depth that are carried out several places in the country. The two figures below illustrate how snow has been scarce in Bergen this recent winter while it has been very snowy in Tromsø. Similar figures for snow depth measurements are available here for several locations in Norway. All snow depth observations made at the Meteorological Institute can also be downloaded from the website seklima.met.no.
 |
 |
As we see, Bergen received less snow than normal this winter, and conditions can change rather quickly with a light sprinkling of snow, as we see in these two pictures taken in Bergen at a 24 hour interval, from 29 and 30 March respectively (photos: Cecilie Wettre).
 |
 |
In Tromsø the snowstorms were lined up all through winter. At the beginning of April, the official measurement of snow depth is around 150 cm at the Meteorological Institute. This may feel like a lot of snow, but it’s actually not a record for this time of year. On the other hand, if you look instead at the amount of snow that has fallen every day and sum it up throughout the winter until 1 April, this year's winter received the 6th highest amount of snowfall in recorded history. The list below shows the 7 most snowy winters in Tromsø since measurements of snowfall started in 1988/1989. The list was created and is maintained by meteorologist Eirik Mikal Samuelsen (see more information at https://www.facebook.com/EiriksVaerblogg, post from April 1 2020):
Accumulated snowfall in Tromsø up until April 1 (and accumulated total for all winter):
| Winter | Snow fall until April 1 | Snow fall all winter | |
| 1. | 1996/1997: | 737 cm | 891.5 cm |
| 2. | 1999/2000: | 712 cm | 798 cm |
| 3. | 1992/1993: | 681.2 cm | 746.4 cm |
| 4. | 1988/1989: | 656.9 cm | 656.9 cm |
| 5. | 1995/1996: | 639.8 cm | 755.3 cm |
| 6. | 2019/2020: | 623 cm | ?? |
| 7. | 2018/2019: | 571 cm | 605 cm |
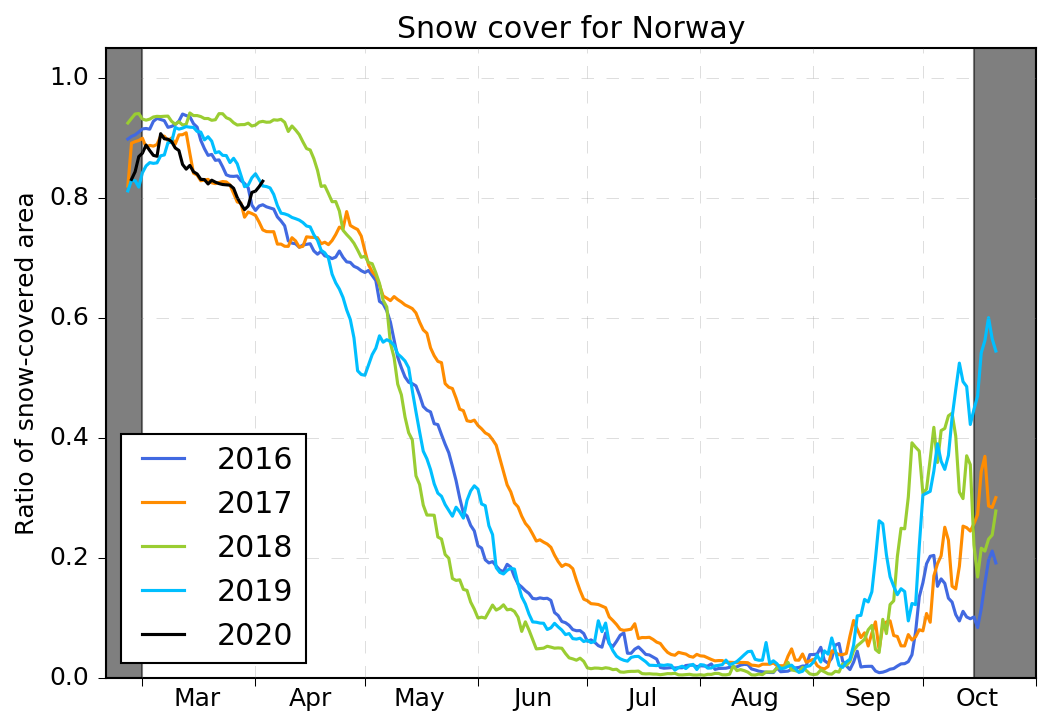
The development of the snow cover can be followed day by day from both ground observations and satellite based maps available at cryo.met.no. In addition, there are snow indices here that show how much of mainland Norway - or any other defined part of the country - is covered by snow. The figure below was generated on 2 April and shows with a black curve how much of mainland Norway has been covered by snow so far this year. The years 2016 to 2019 are shown for comparison. This type of snow index also makes it easier to compare the current situation with previous winters.