
On behalf of the OSI SAF sea-ice team, we are happy to present the new OSI SAF Sea Ice Index v2.1 (OSI SAF SII v2.1).
The Sea Ice Index is derived from the OSI SAF Global Sea Ice Concentration products (OSI-450 & OSI-430-b), which are based on satellite passive microwave data. Therefore, the data are covering the last 40+ years, from 1979 to the present time.
The index consists of both the sea-ice extent and sea-ice area information.
|
|
|
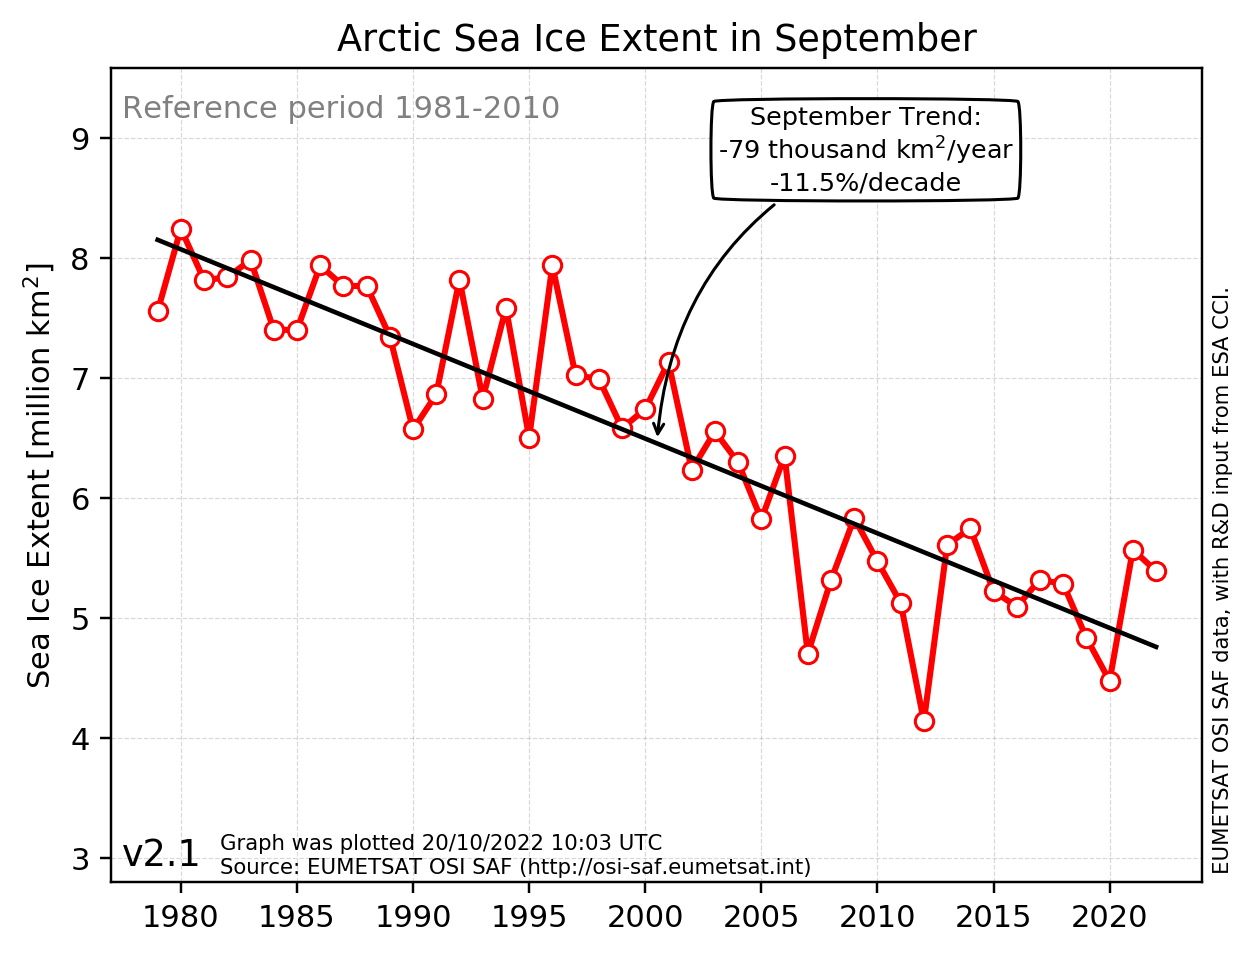
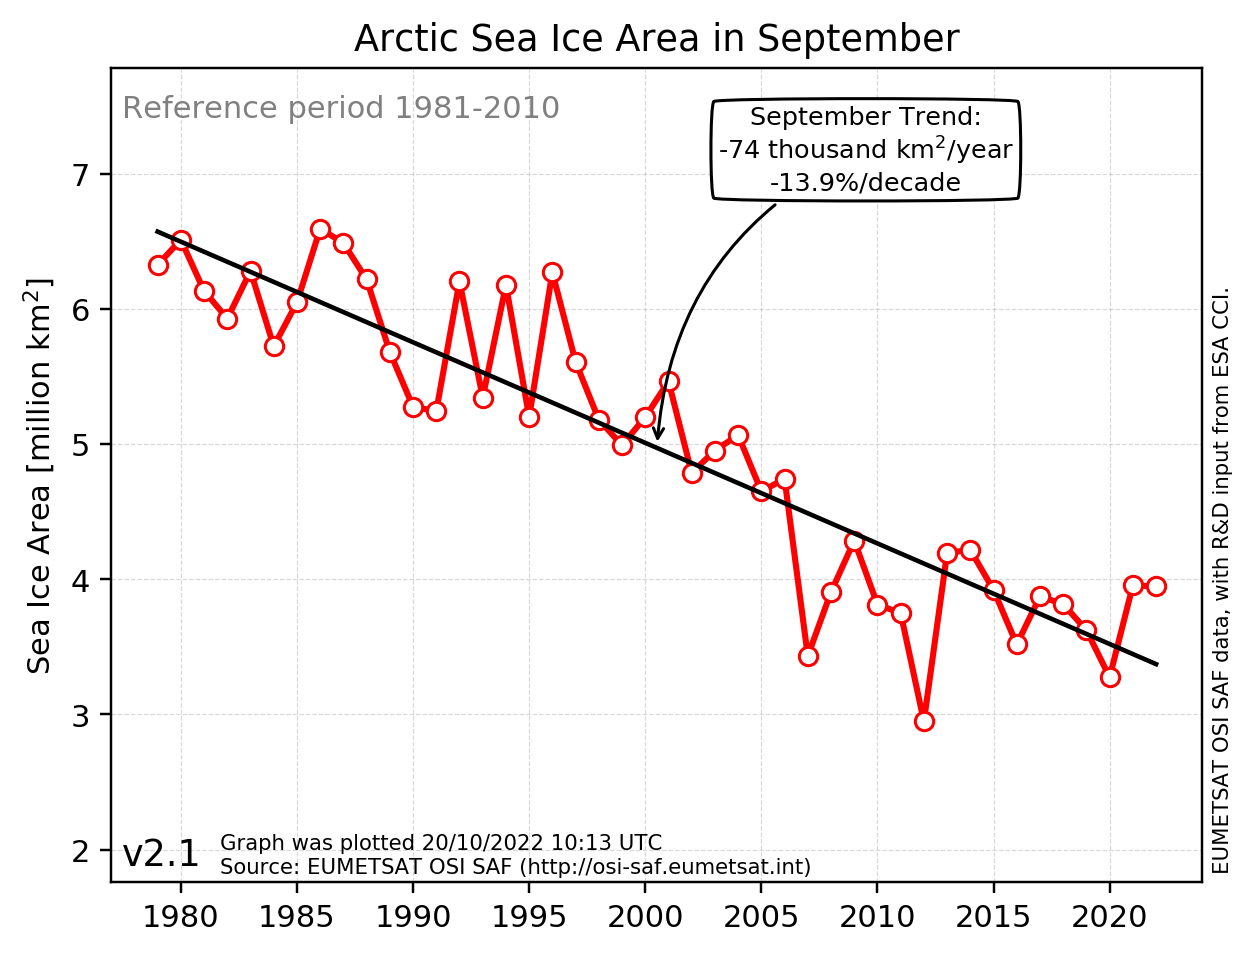
Both sea-ice extent and sea-ice area are measures of the ice-covered area in a region, and sea-ice extent is always larger than sea-ice area, as can be seen above in the September time series of Arctic sea-ice extent and sea-ice area, respectively. The sea-ice area is the total area of the sea ice itself, whereas sea-ice extent here is defined as the total sea surface that is ice-covered according to the 15% ice concentration threshold. This means that the sea-ice extent also includes many square kilometres of ice-free water between ice floes, which is the reason why sea-ice area should be preferred for some applications, and the sea-ice extent is used in others.
With the new release comes an updated series of graphs (.png) visualising the trends and evolution of sea ice at global, hemispheric, and regional scales. Below are shown examples of the different available types of graphs.
|
|
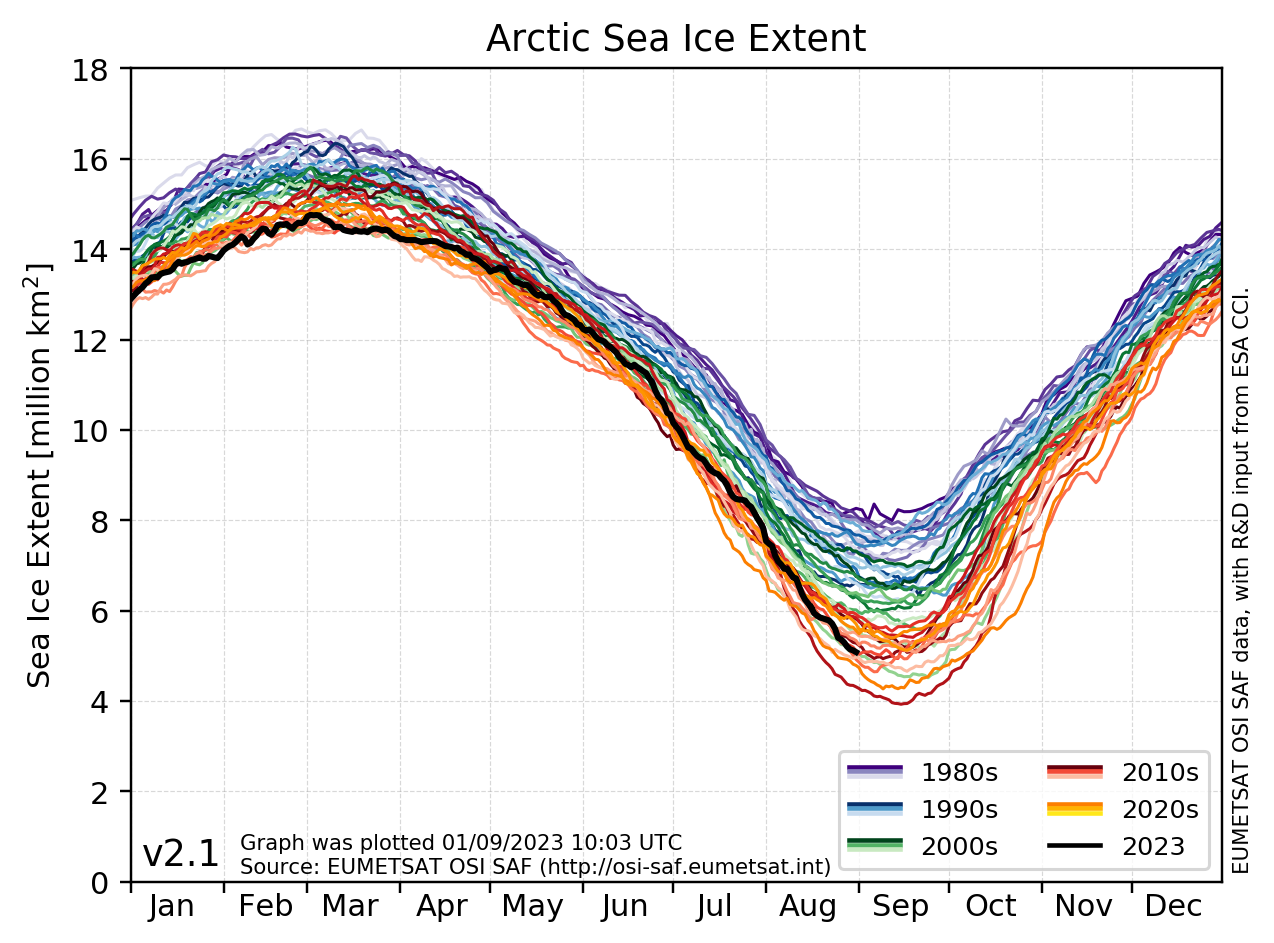
“daily-all” Daily sea-ice extent values from all available years have been plotted with the line color representing the individual year. The colors are selected so that the years are grouped into decades. |
|
|
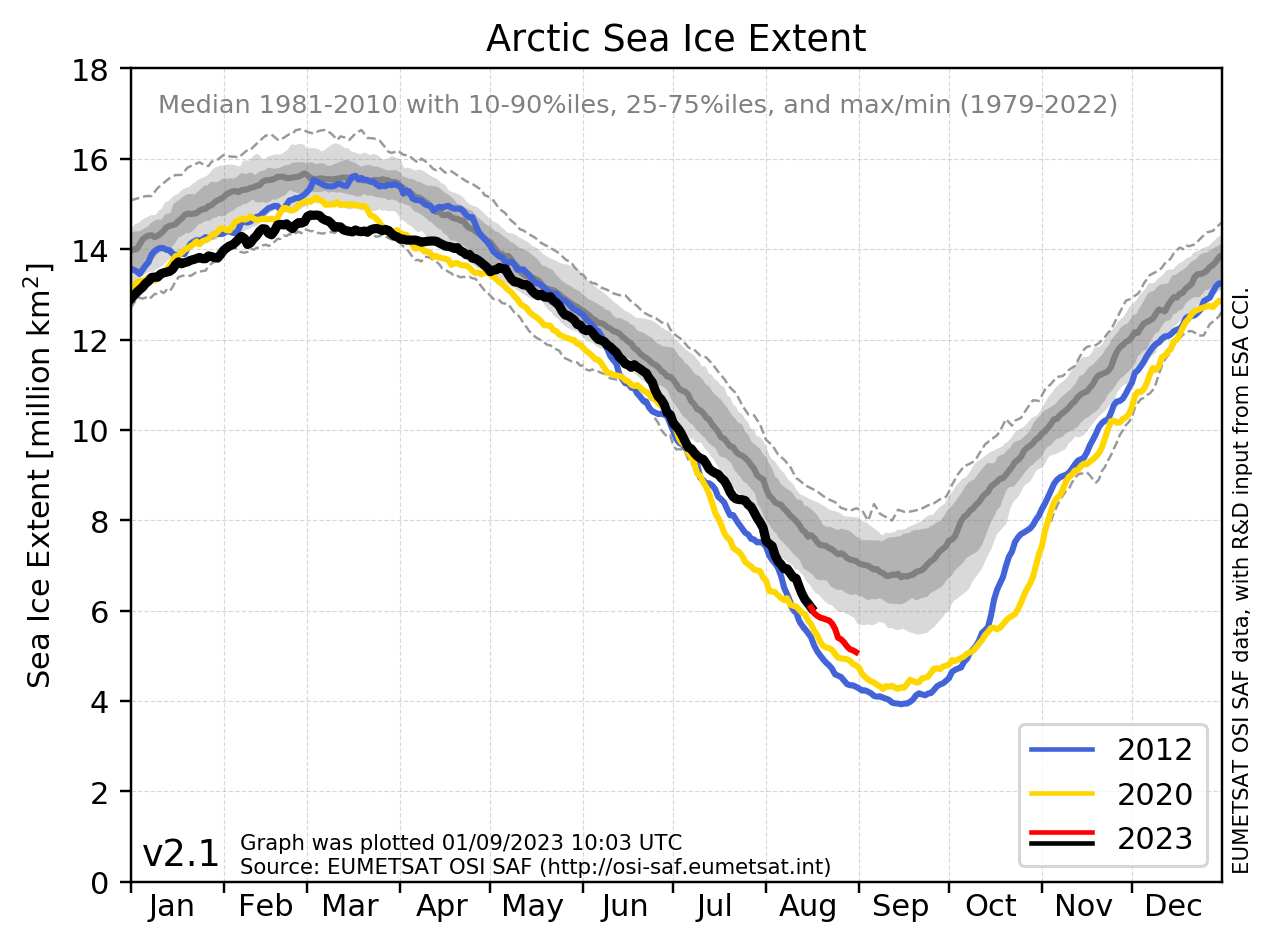
“daily-5years” Daily sea-ice extent values from the current year, plus the five recent years with colored lines (blue to light-green). Note, that the present year combines a black and a red line which represents the slightly different retrieval methods behind the data. The black covers the ICDR data, and the red is the supplementing near-real-time data. In grey, the sea-ice extent median of a 30 year reference period (e.g. 1981-2010) has been plotted together with the 10/90 and 25/75 percentiles. |
|
|
“daily-2years” This graph is similar to the graph above, “daily-5years”. However, the two extra selected years represent, for the NH: the recent two years with record-low sea ice in the NH, and for SH: they represent the years with record-high and record-low, respectively. Again, in grey is shown the 30 years climatology - median and percentiles, and now with the grey dashed lines marking the record-high and record-low daily values throughout the year for the full record, 1979 to last-year. |

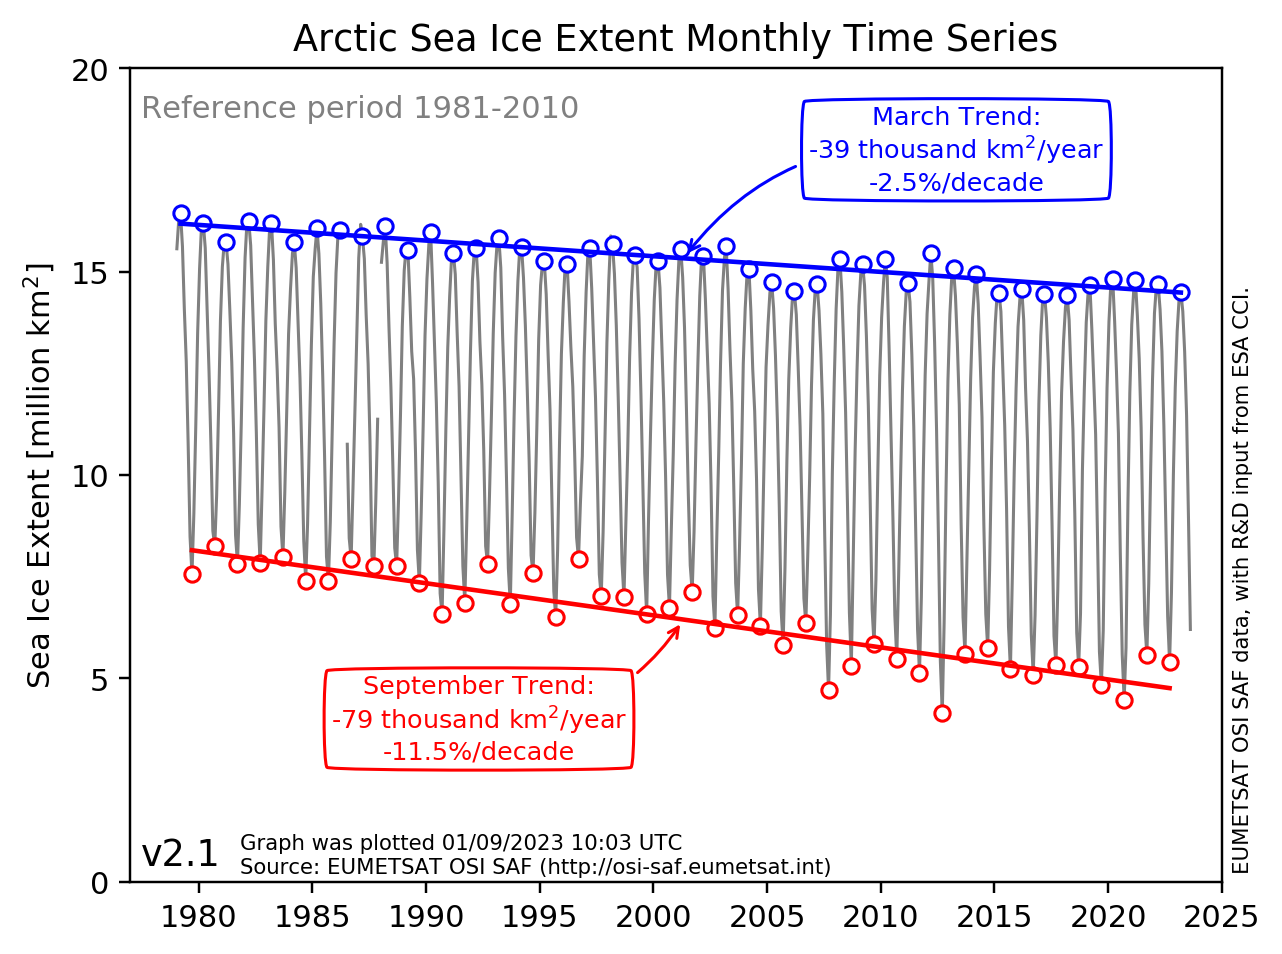
The monthly mean values are also provided. Monthly time series, including long-term trends, are plotted for each month (shown in the first two figures above). In addition, the following graphs for the monthly data are made:
|
|
“monthly-all” Monthly mean values for sea-ice extent are plotted for all available years of data. The two months representing maximum and minimum ice conditions are highlighted and trend lines are included for these months. For all regions in NH, March and September represent the maximum and minimum, respectively. While for the regions in SH, September and February are outlined. |
|
|
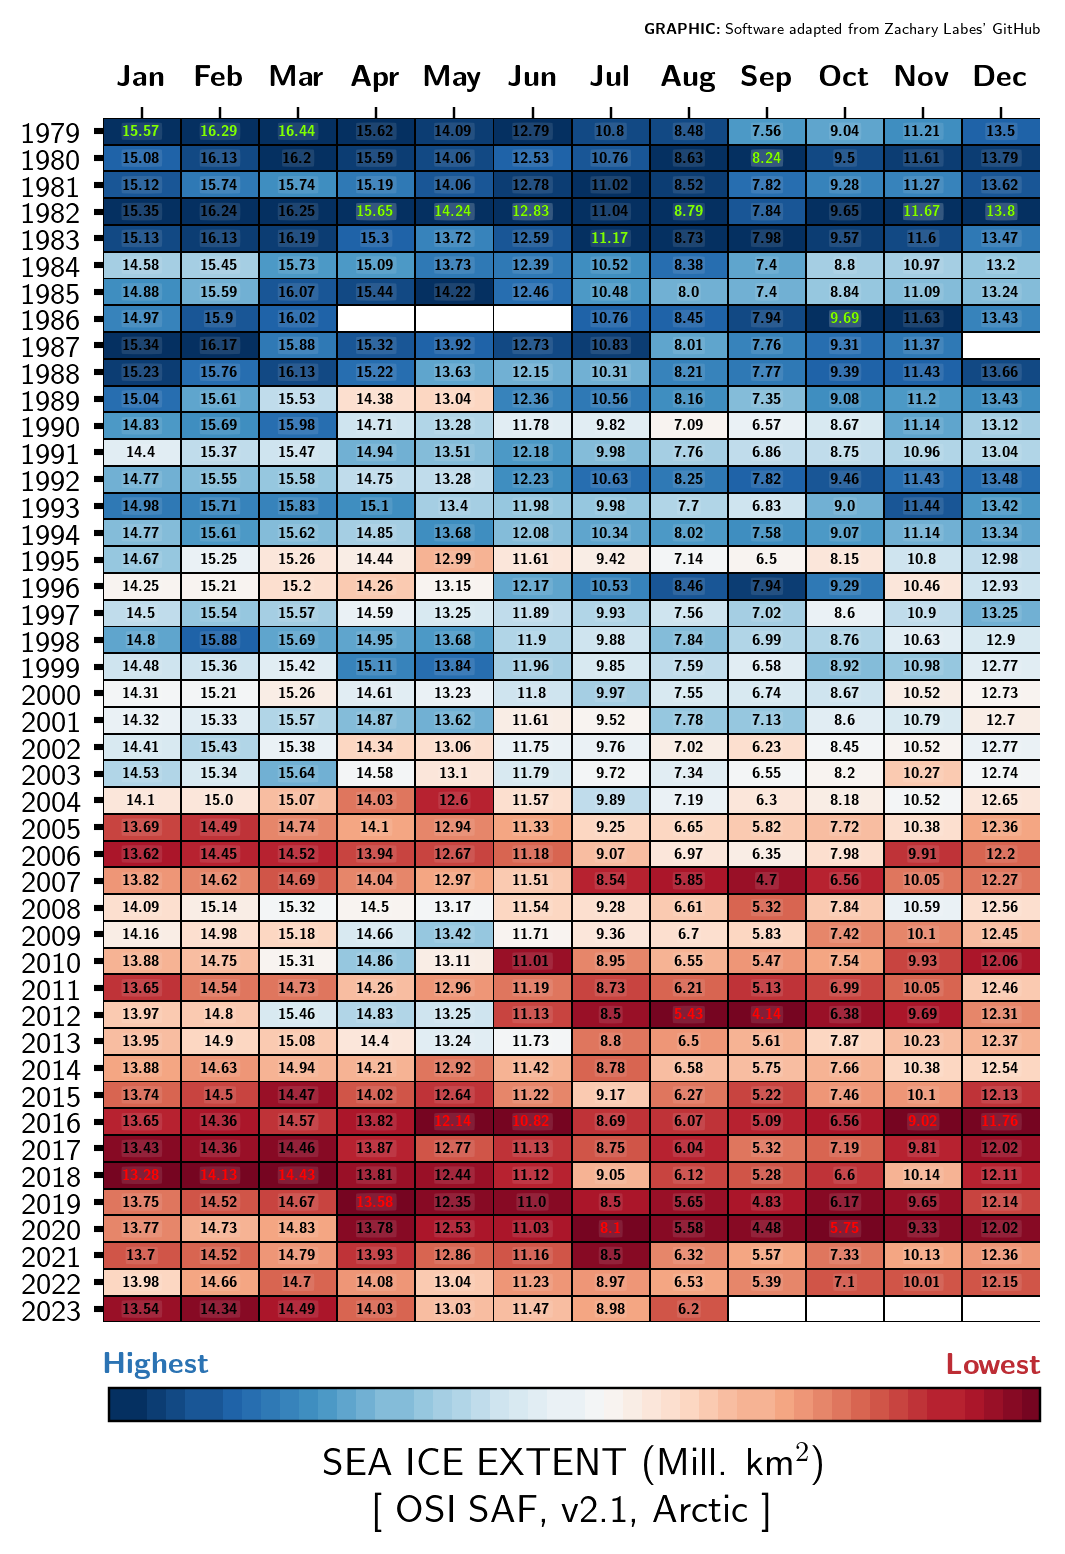
“monthly-values” Monthly mean values for sea-ice extent are listed with numbers [million km2] in a table plot with rows/columns representing years/months. The background color-coding is the ranking-by-month of the ice extent values, with dark-red cell (and red label) being record-low extents for that specific month, and dark blue cell (and green label) being record-high values. |
|
|
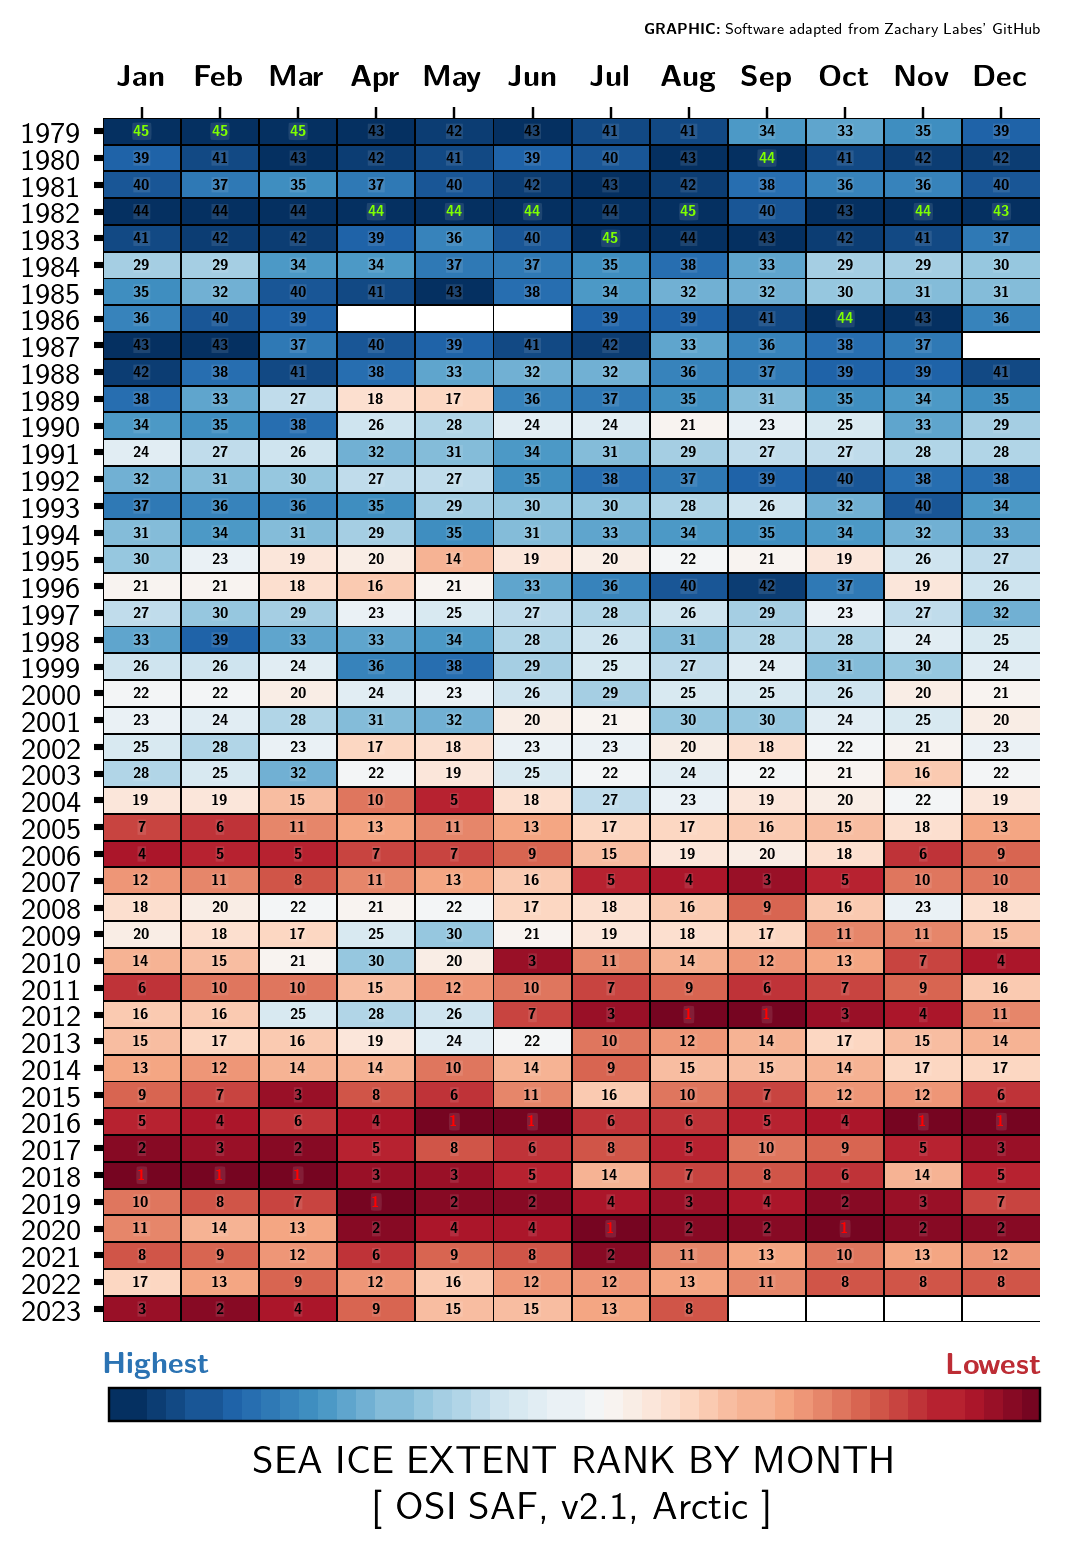
“monthly-ranks” This graph is similar to the graph above, “monthly-values”. The only difference is that the labels show the rank-by-month, with “1” being the record-low, and the highest number (e.g. 41 or 42) being the record-high. |
Note, that in the examples above, only the Northern Hemisphere sea-ice extent is shown. The same type of graphs exists for all regions and also for the corresponding sea-ice area data.
You can browse all available and updated graphs online on the cryo website or the OSI SAF website.
The data files (.txt and .nc) are also available and can be accessed from either the cryo website or directly from the OSI SAF FTP server.
To get more information about the Sea Ice Index v2.1, please have a look at the corresponding OSI SAF Product User Guide, available here.
This service message was first published at http://www.osi-saf.org/ (25/11/2020)