
The sea ice in both the Arctic and Antarctic stands out this year as having ice extents among the top ten lowest on record. In the Arctic, the annual minimum ice extent has just been recorded as the ninth lowest since measurements began more than 40 years ago. In Antarctica, where winter is now over, the annual maximum extent is the seventh lowest on record.
Every year, when the melting season for the sea ice in the Northern Hemisphere ends and the winter cold sets in, researchers at Denmark's and Norway's meteorological institutes, DMI and MET, summarize the extent of the sea-ice extent in the Arctic. Almost at the same time, the sea ice in the Southern Hemisphere reaches its maximum extent, as the winter season ends in the south.
Minimum in the Arctic
In the Arctic, the minimum occurred on 17 September, with an extent of 5.1 million km2. This ranks ninth for lowest minimum ice extent records since 1978, the year that sea-ice extent began to be monitored with satellites. According to DMI's sea-ice researcher Gorm Dybkjær, this year’s extent is the result of a 'steady' melting season:
- In light of the fact that in recent years we have almost come to expect the news of record-low ice covers, it is positive that the sea ice is, after all, outside the top 5. But the low extent also emphasizes that in the long term the ice is getting smaller year by year, and this year's minimum is still well below normal.
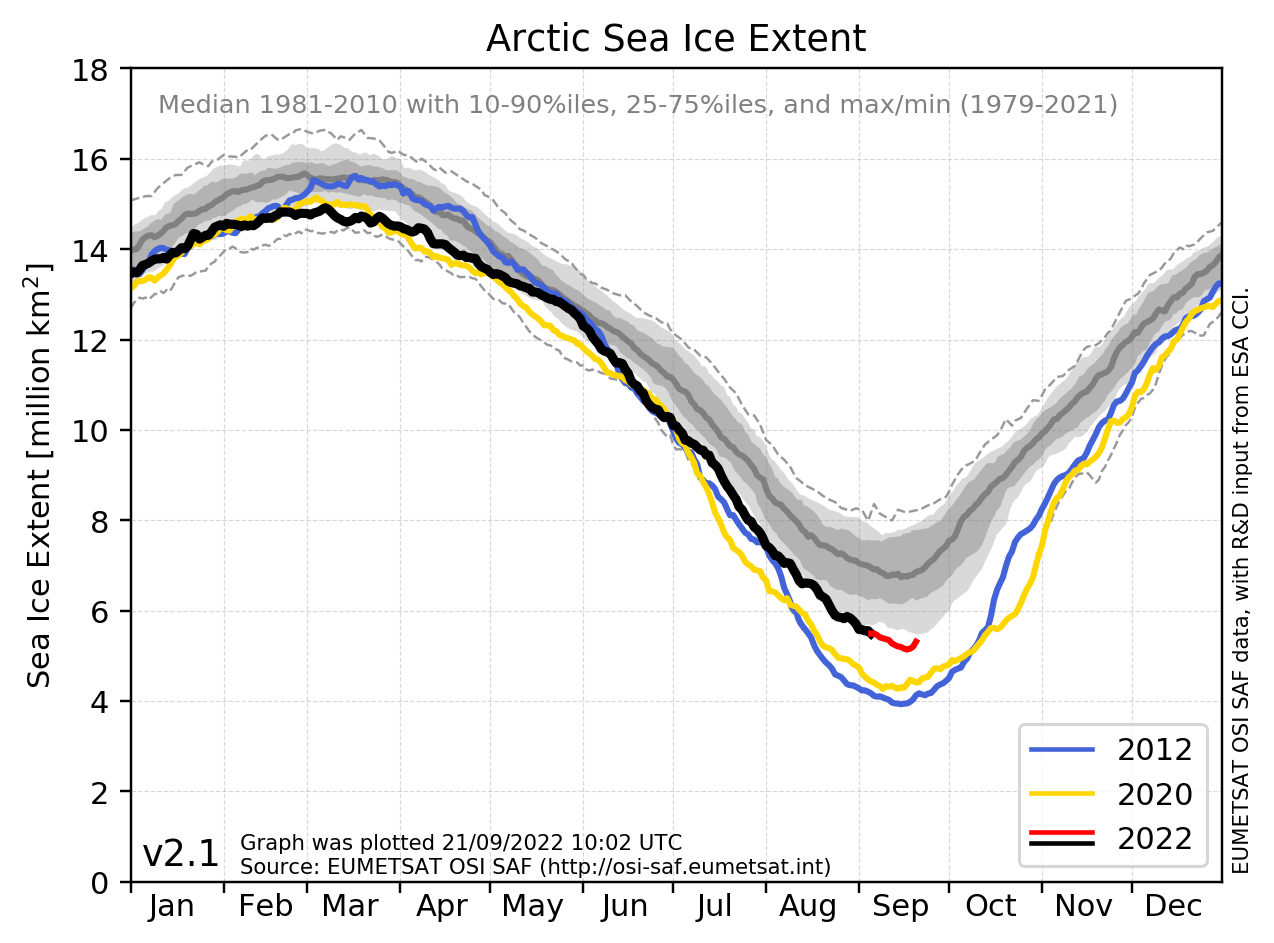
The figure shows time series of daily sea-ice extent for the Arctic during this year (black/red). The reference curves for 2012 (blue) and 2020 (yellow) are the two years with the lowest ice extents ever recorded in the Arctic. The grey curve shows the median for the reference period 1981 - 2010.
The weather from May to September is a key factor in the final ice extent. Another important factor is the timing of when the melting season starts. This year, the melting season started just over a week later than normal. Gorm Dybkjær elaborates on why the timing of the start of the melting season is important for the entire melting season:
- When the first melting episode has occurred, the snow, which lies on the sea ice after the winter season, loses its light color and the surface becomes darker. The darker sea ice absorbs the heat better than the white snow, which reflects the sunlight back. Thus, the dark surface accelerates the rate of sea ice melting. The later the melting starts, the less the total melting will be.
Facts | When does the melting season start?
The melting season begins when the surface temperature of the ice first exceeds 0 °C.
The season does not begin at the same time throughout the Arctic, but a good indicator is when the average surface temperature north of 80 °N exceeds 0 °C. Based on almost 50 years of reanalysis data, this happens statistically on 12 June.
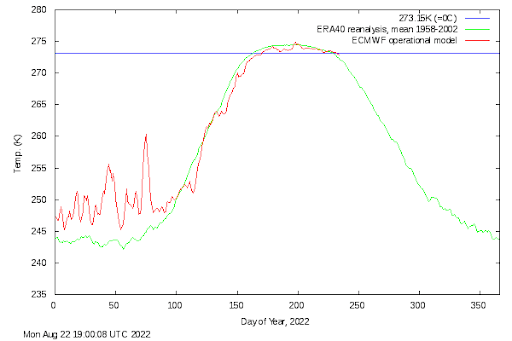
The figure shows the average surface temperature north of 80 °N. The green curve shows the climatological surface temperature (1958-2002), and the red curve shows the surface temperature for 2022 until 6 July. Data is based on a climate model from the European global weather model ERA40 from ECMWF (European Center for Medium-Range Weather Forecasts).
Big differences
Although the Arctic as a whole now has the ninth lowest extent that has been measured, there are regional differences in the various parts of the Arctic Ocean. Especially in the Barents Sea and in the area around Svalbard, the sea-ice extent has been very low due to temperature and currents:
- The sea ice disappeared exceptionally quickly in the Barents Sea at the turn of the month between May and June. This was partly driven by a strong northward movement of the ice, which was observed over several days. Thus, the ice was physically moved out of the Barents Sea. Furthermore, record high temperatures were observed on Svalbard in June and July, and the surface temperature in the Barents Sea north of Scandinavia has been higher than normal, which has contributed to the low extent of sea ice in the area, says Signe Aaboe, climate researcher at the Meteorological Institute.
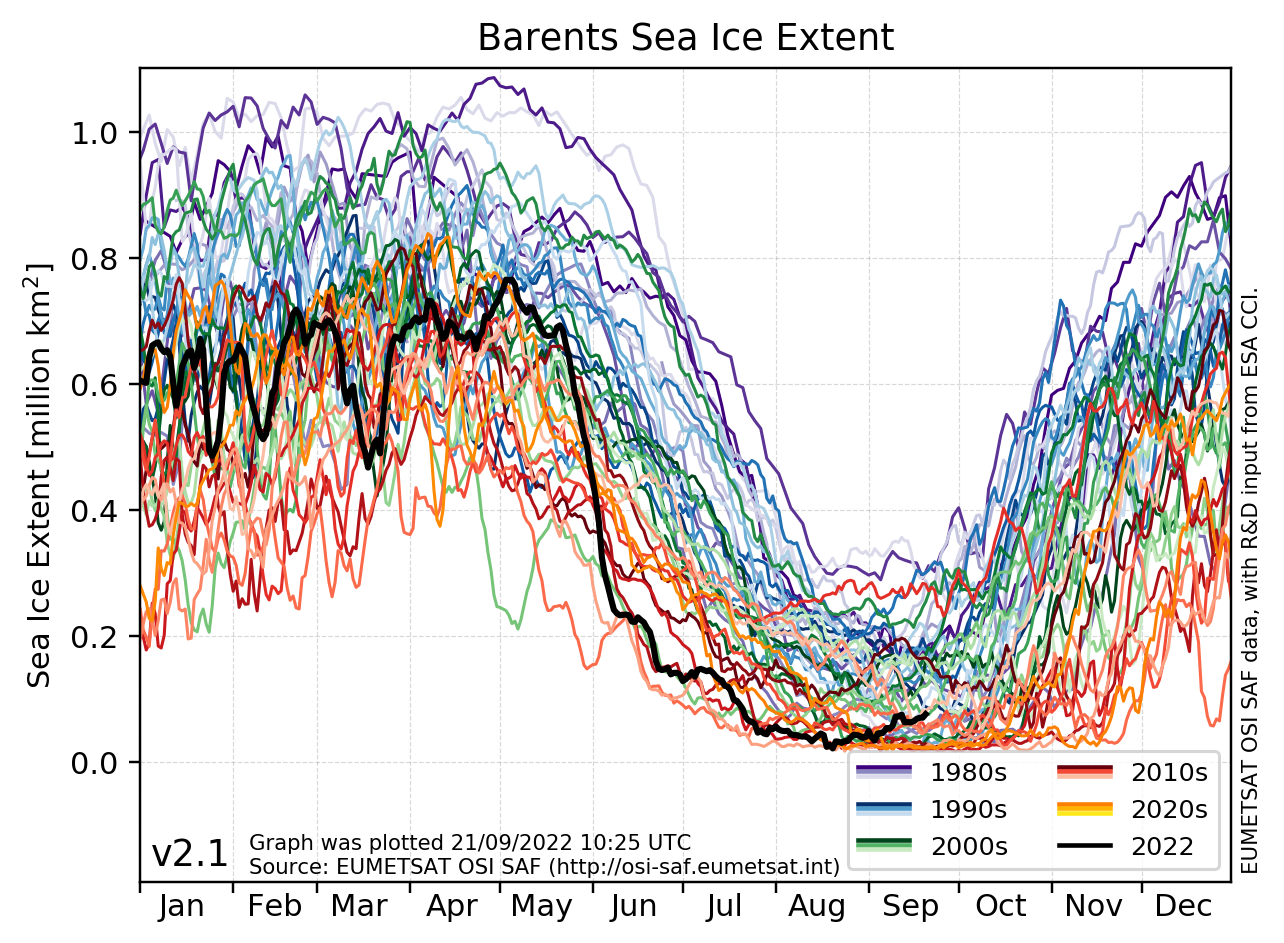
The figure shows the regional sea ice extent in the Barents Sea. Note the very sharp decline in May/June this year (black line).
The rest of the inner Arctic, on the other hand, has had a relatively cool summer, and thus the sea ice in the Arctic as a whole has had a low, but not extremely low extent.
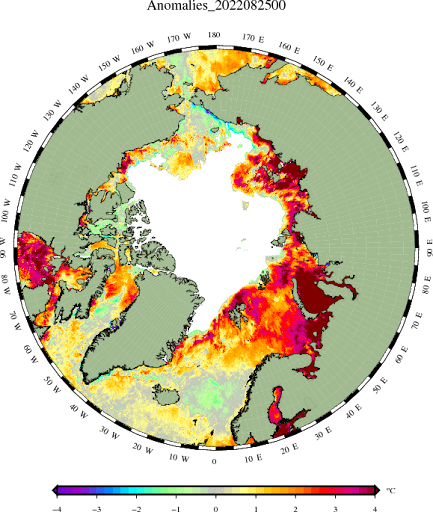
Temperature anomalies in the sea surface north of the 58th parallel on 25 August 2022. High temperatures (positive anomalies) are seen especially in the Barents Sea and the sea around Svalbard, in the Laptev Sea and in the Hudson Bay, where the sea ice melted early this year. Figure from DMI.
Spring at the South Pole
In Antarctica, the situation is completely different. Winter is almost over and spring is on its way. The sea ice reached its annual maximum extent on 13 September. But before the winter of 2022, the Antarctic summer was characterized by exceptionally high temperatures, which gave a record low extent of the sea ice as a starting point.
- We have seen a record low extent of sea ice in Antarctica over the past year, and in particular the freezing of the Weddell Sea, the southernmost part of the Atlantic Ocean, has taken a long time. In return, the ice has re-established itself exceptionally quickly on the other side of the Antarctic Peninsula towards the Pacific Ocean between New Zealand and South America. So here we also have big regional differences, says Signe Aaboe and elaborates:
- The annual maximum extent, which has just been measured, is 18.7 million km2. This is the seventh lowest maximum extent measured for Antarctic sea ice.
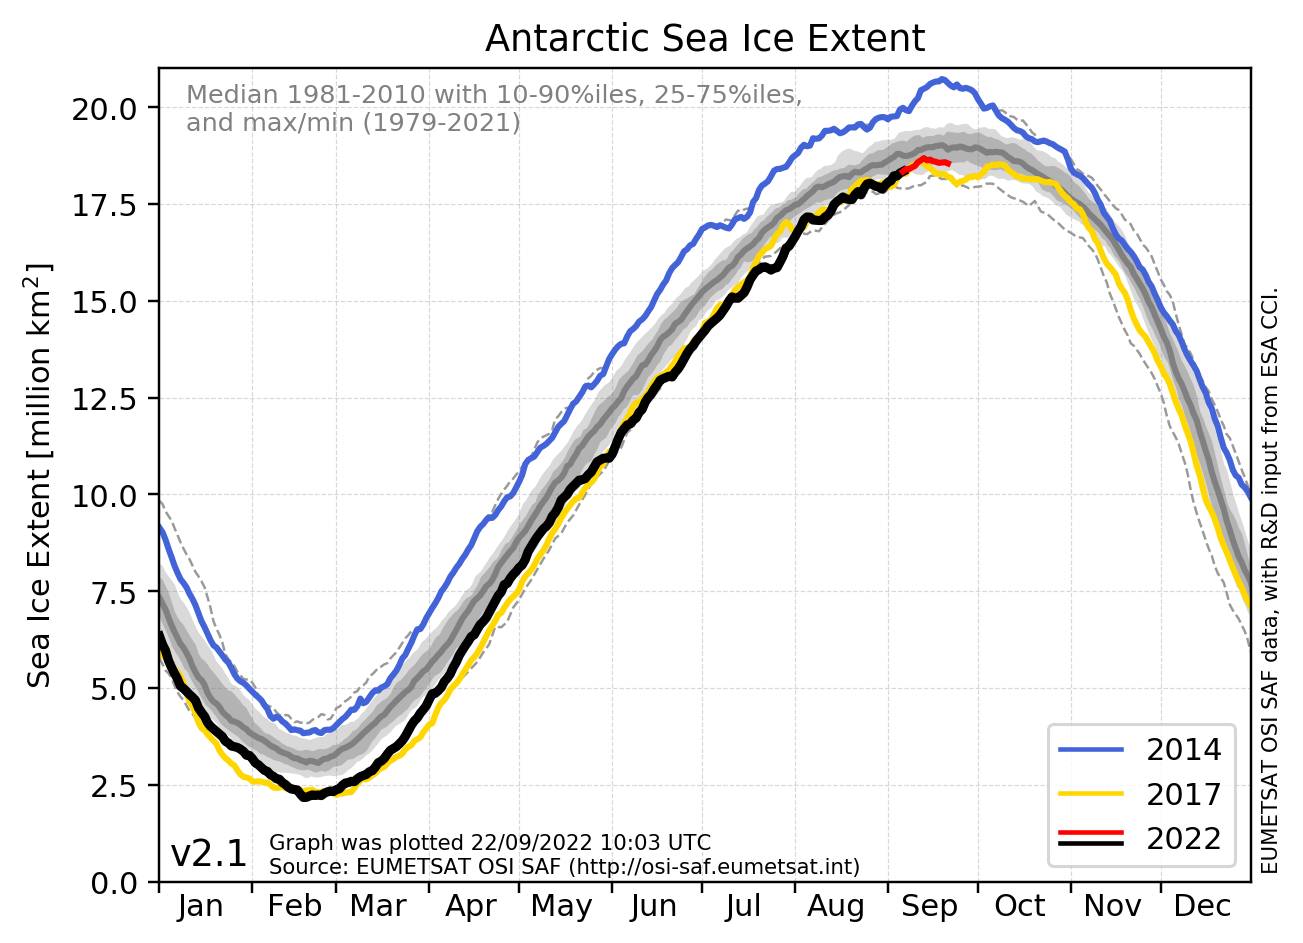
The figure shows time series of daily sea-ice extent for the Antactic during this year (black/red). The reference curves for 2014 (blue) and 2017 (yellow) represent the years of record-high and record-low ever recorded in the Antarctic. The grey curve shows the median for the reference period 1981 - 2010.
Facts | Ice extent
Because of the sea ice's bright surface, it reflects a large part of the sunlight's energy back into the atmosphere. When the sea ice melts, the surface becomes darker, and the ocean can absorb more heat. Therefore, sea ice plays a major role when it comes to climate change. Less sea ice means more open sea, which can be warmed by the sun's rays. Thus, a reduction in sea ice can accelerate global warming.
For the same reason, sea ice and climate scientists keep an eye on the extent of sea ice both in the north and south, and here it is natural to note the time of minimum and maximum, as well as how large the extent is. In particular, the minimum extent of the sea ice says something about how much multi-year ice is left. The multi-year ice is extra thick and many years old, and it is difficult to rebuild. New ice that forms during the winter is thinner and thus also more exposed the following summer.
Maximum and minimum distributions occur in connection with the change of season in the Arctic and Antarctic. When it is winter in the Arctic, it is summer in Antarctica. Therefore, the times of maximum and minimum extent in each hemisphere occur largely at the same time.
Facts | Norwegian-Danish ice research
Researchers at the Meteorological Institute in Norway (MET) and Denmark (DMI) have for a number of years collaborated closely on ice analyses based on satellite observations. The satellite observations are part of the European research project Ocean and Sea Ice Satellite Application Facility (OSI SAF).
This news story has been created in collaboration between MET and DMI.