
The yearly maximum Arctic sea-ice extent occurs in February/March, which is also the timing for the yearly minimum Antarctic sea-ice extent. The Norwegian Meteorological Institute uses satellite data to track and describe sea-ice extent on a daily basis.
Sea-ice maximum in the Arctic
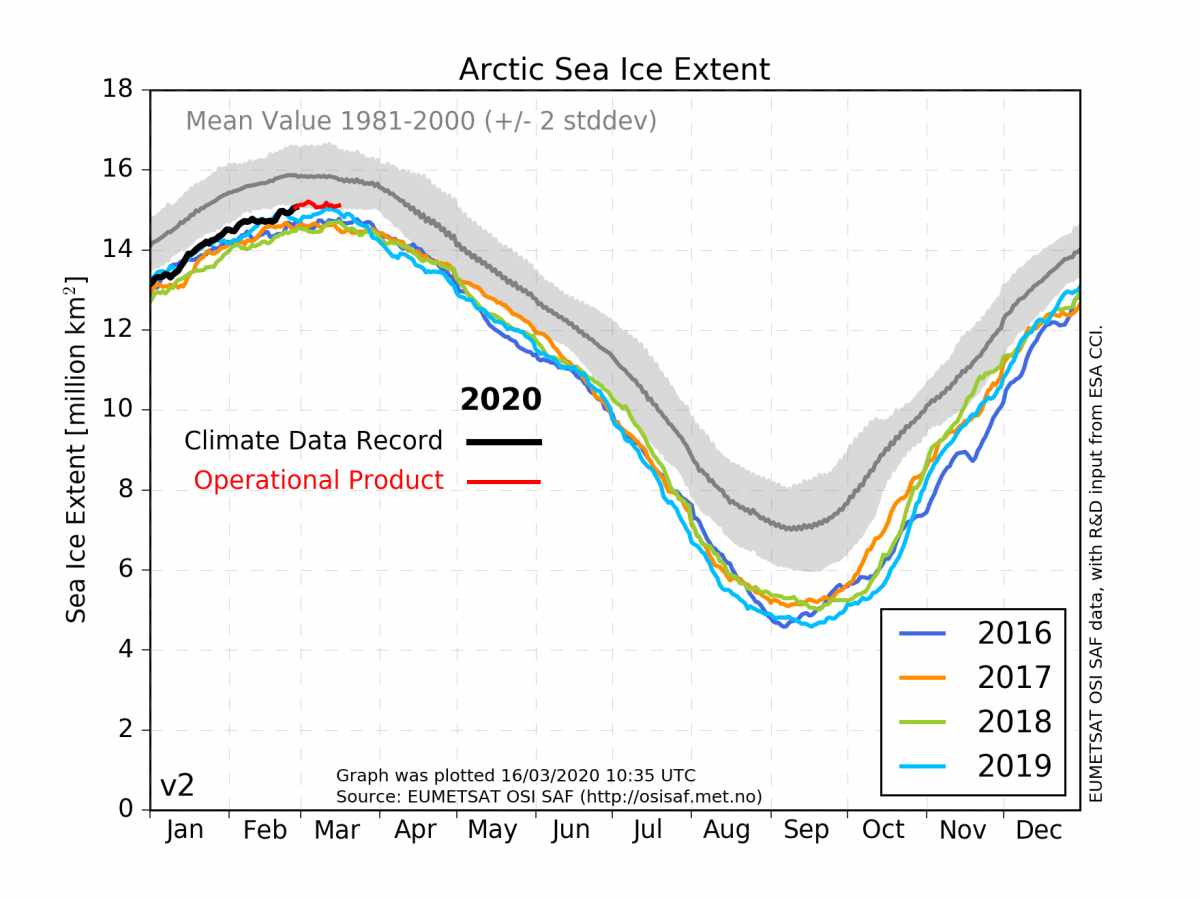
This year’s Arctic maximum sea-ice extent occured on March 3 with a coverage of around 15,2 million km2. Figure 1 shows the daily sea-ice extent for the previous 5 years, including 2020. The mean estimates based on 20 years of data prior to 2000 have been included for reference. The 2020 Arctic maximum is higher than the previous 4 years, but is well below the mean maximum of the reference period (close to 16 million km2).
Can the winter sea-ice extent predict the following summer sea-ice conditions?
In the animation in Figure 2 the years 2007 and 2012 have been added for comparison. 2007 and 2012 represent the two previous years where the Arctic sea ice had the record-low coverage in september with less than 4 million km2 in 2012. However, their corresponding sea-ice extent in March did not seem to give any preconditioning to the following summer minimas. While 2012 had a maximum extent in March near the 1981-2000 average value, the same year still holds the current September minimum extent record. 2007, on the other hand, had low extent values both during maximum in March and minimum in September - seen in relation to the average based on 1981-2000. This demonstrates that the maximum extent in March cannot predict the September minimum level. Thus, a relatively high March level compared to the most recent year cannot be taken as evidence that the Arctic sea-ice “has recovered”.
Sea-ice minimum in the Antarctic
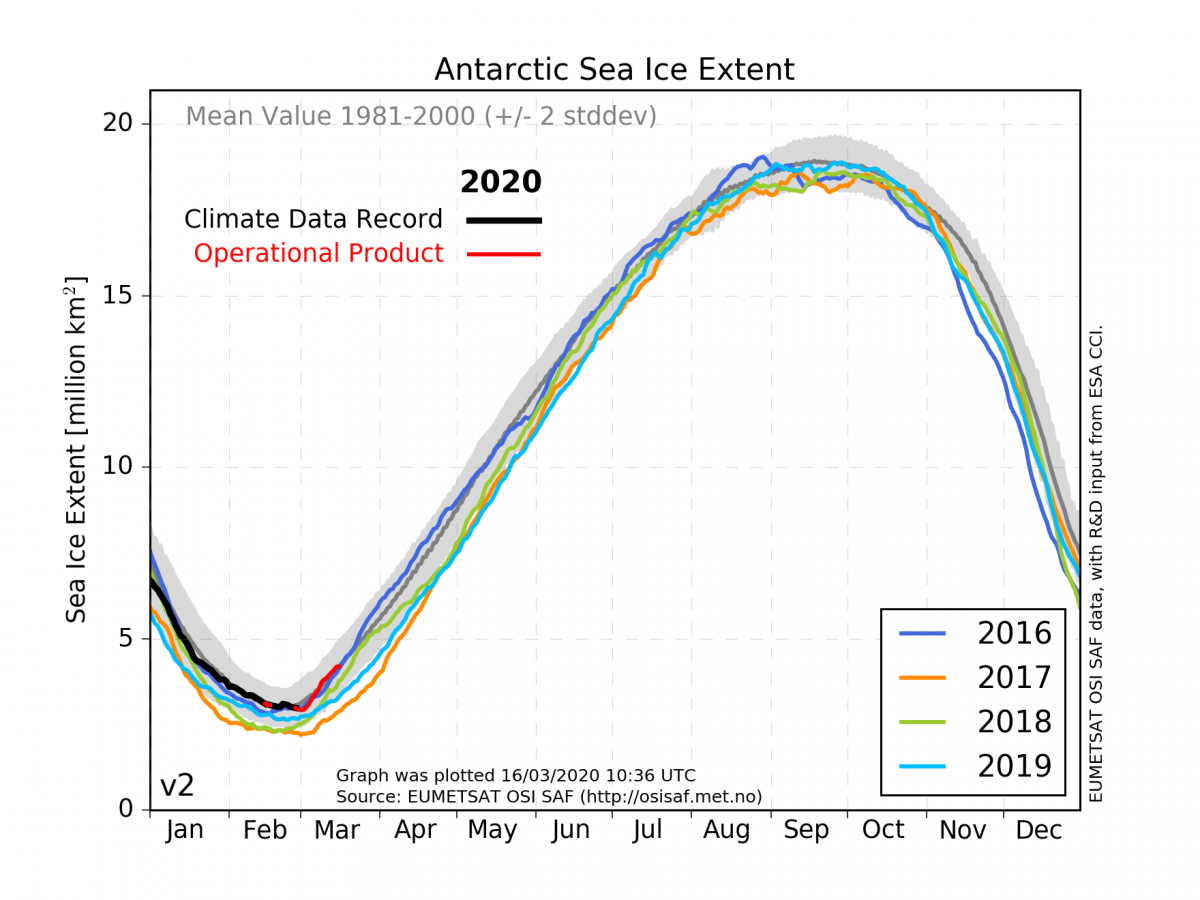
The 2020 Antarctic minimum sea-ice extent occured on February 29 with around 2.9 million km2 of ice cover. As seen in Figure 3 this year’s sea-ice extent follows the mean 1981-2000 values, however with a later occurrence of the minimum this year. The minimum generally happens in mid February, but a rather “late” minimum as this year is not exceptional, see e.g. the very late minimum in 2017.
Global versus regional sea-ice extent
While the areal coverage of sea ice generally has a negative trend with time globally and especially in the Arctic, the regional sea ice can be very dense in some areas. This is the case with the sea-ice conditions around Svalbard this winter where we observe more sea ice than the 1980-2010 climatology, see Figure 4.
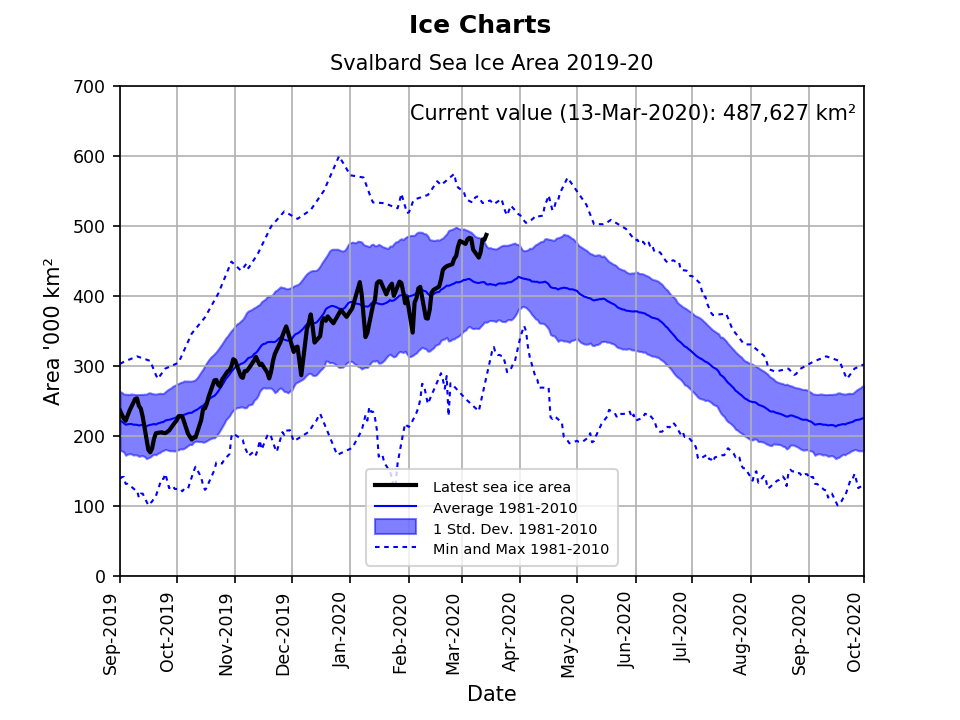
These are local conditions which have a significant impact regionally, but are not in contradiction with a global climate warning with less and less sea-ice.
More sea-ice climate indicators can be found here.
Fact box
Sea-ice extent is the area covered by a significant amount of sea ice. Here, sea-ice extent is defined as the area of ocean surface covered with more than 15% sea-ice concentration.