
Summer is approaching fast. During the last month snow covering approximately 150,000 square kilometers of land has melted, as the total snow-covered area for Mainland Norway has gone from 60% to 10%.
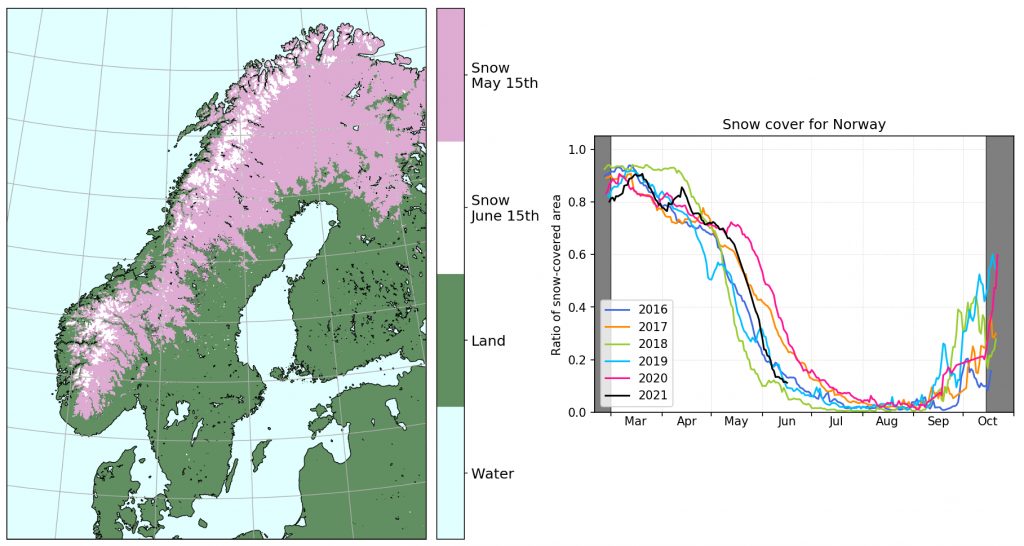
The map to the left shows the snow cover on May 15th in pink and the remaining snow on June 15th in white. The figure to the right shows the snow cover index for Mainland Norway for the years 2016 - 2021. This year's curve (black line) shows that the total snow cover by the end of the winter was about the same as for the previous 5 years. The snowmelt has however been relatively fast during the last month compared to the most recent 5 years. The exception is 2018, when a snowy winter turned into a warm spring, with an unusually efficient snowmelt.
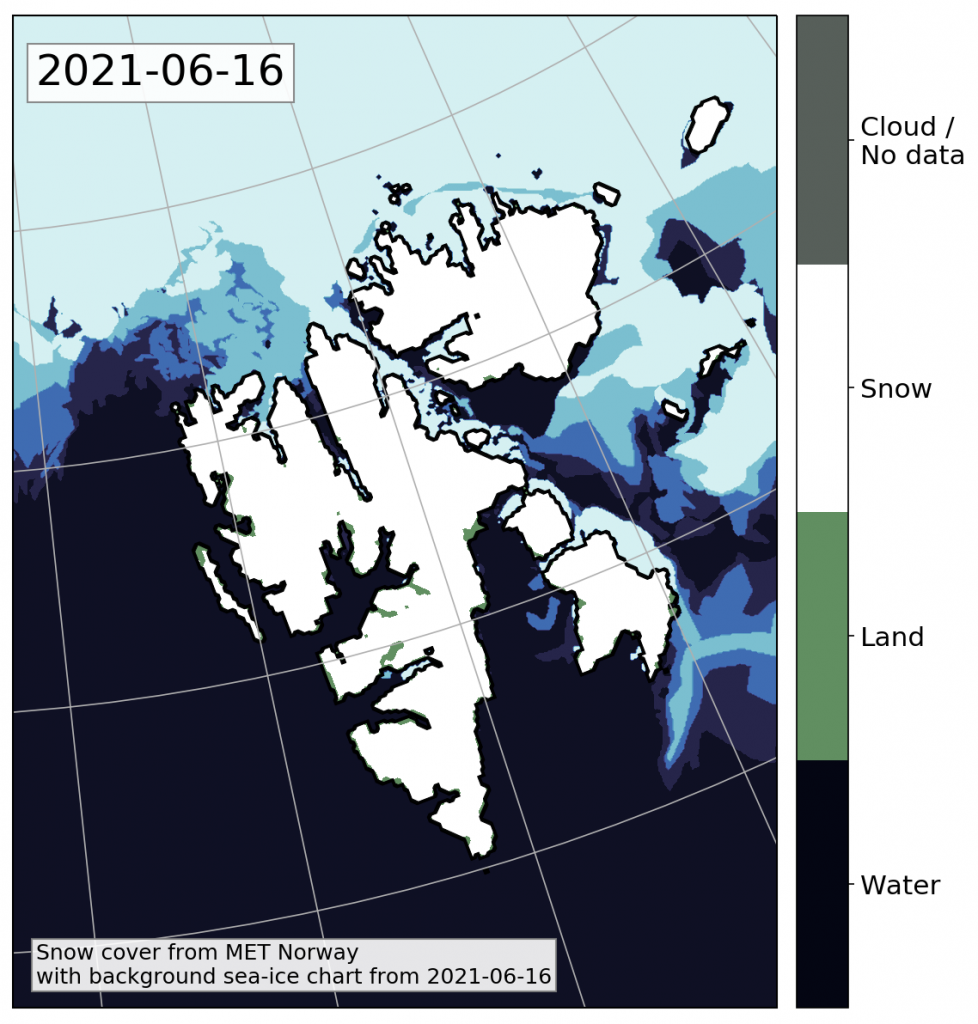
The snowmelt has also started on Svalbard. This map shows that the large valleys on Nordenskiöld Land have become snow-free. (Note that large parts of Svalbard are covered by glaciers, which are also shown as "snow" in this map.)
The maps shown above, as well as the snow cover index, have been derived from satellite measurements from the AVHRR instrument. AVHRR has been an important instrument for meteorological purposes since the early 80s, and is used for monitoring clouds, land, ocean state, aerosols, etc. Due to the long data record, AVHRR data is also useful for studies of climate change. The instrument has a spatial resolution of approximately 1 km, which means that smaller scale details will not be visible.
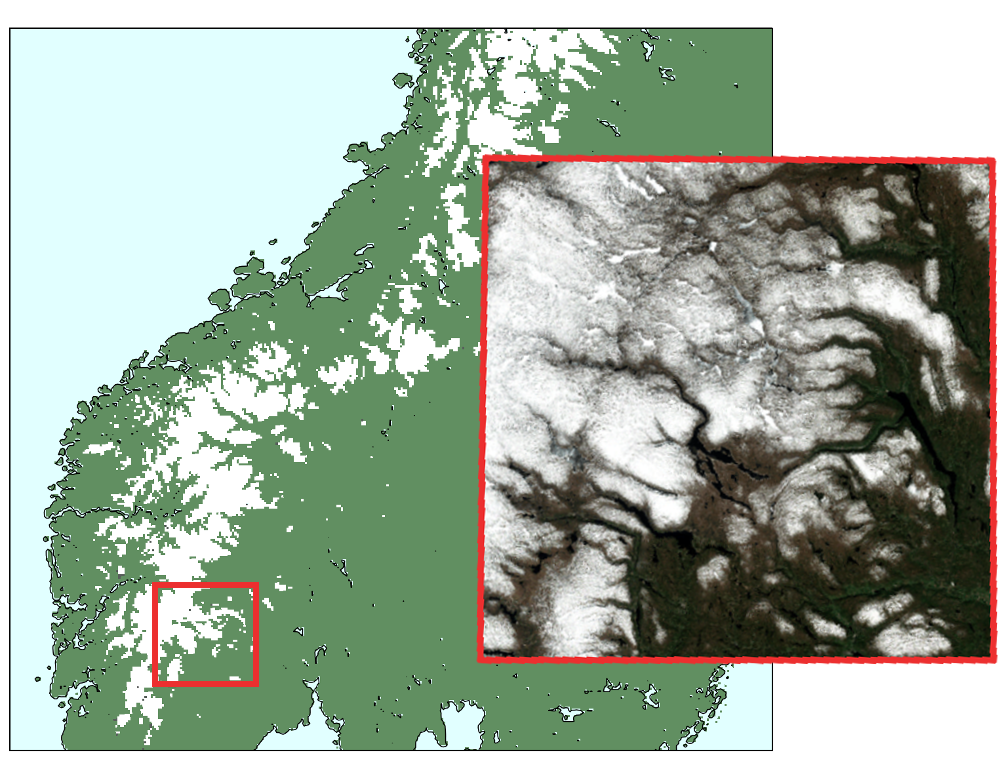
The background map in this figure is a snow map from AVHRR for April 30th 2021. The inset image in the foreground is a satellite image from the MSI instrument on Sentinel-2A, taken the same day. Shown in the red box are the eastern parts of Hardangervidda. Møsvatn can be seen in the center of the image in dark blue/black. The mountain area Vegglifjell is to the right, and the snow-covered Mælefjell and Lifjell can be seen bottom right. The boxed area was cloud-free at the time the MSI image was taken, which means that white represents snow-covered land or ice-covered lakes. The MSI instrument has similarities to AVHRR, but with a spatial resolution of 60 meters or less, MSI can provide images and products with far more detail than is possible using AVHRR. AVHRR, on the other hand, has very frequent coverage at high latitudes, and global coverage daily. At present (June 2021), the instrument flies on 5 polar orbiting satellites. MSI has a narrower field of view, and does not give global coverage daily. Furthermore, it requires far more computer resources and storage space to process satellite data of this high resolution.
Researchers at the Norwegian Meteorological Institute use remote sensing data from a wide range of satellite instruments. This data is the basis for many of the cryosphere products presented at cryo.met.no.
Fact box
The snow cover index gives an estimate on the fraction of a land area that is covered by snow, and is given in the range from 0 (snow-free) to 1 (fully snow-covered). The numbers are derived from satellite-based snow cover maps. Grey areas indicate the time of year for which the snow cover maps have areas of missing data due to polar night or insufficient amount of daylight.
Previous news stories on snowmelt in Norway: