
November 2020: We are rolling out a new set of sea-ice index and graphs, with updated methodology. Check the newest version of the Sea Ice Index here.
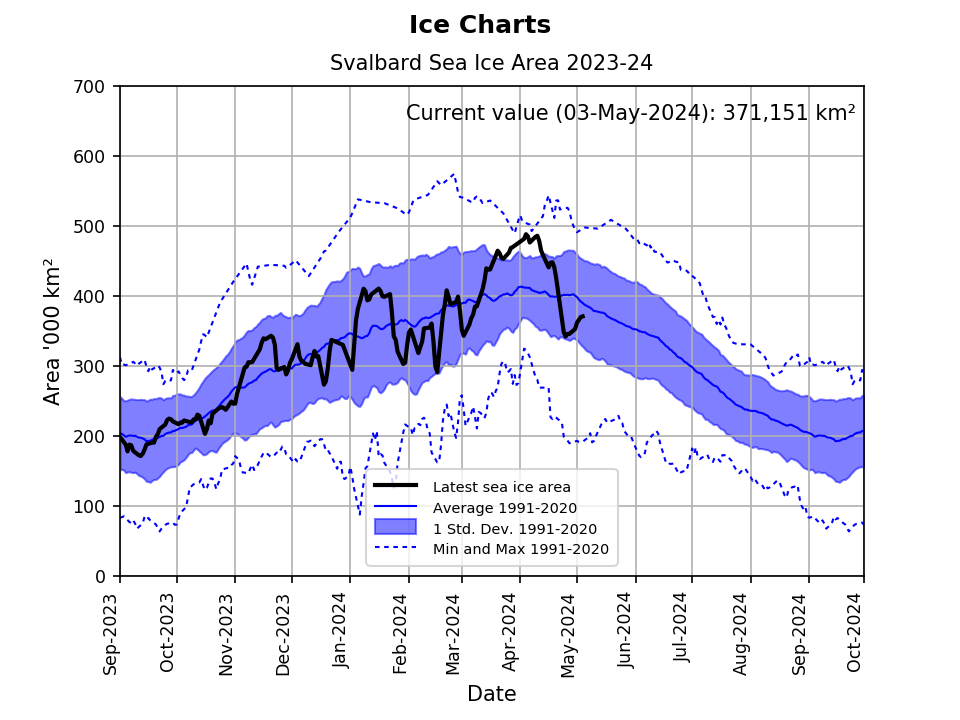
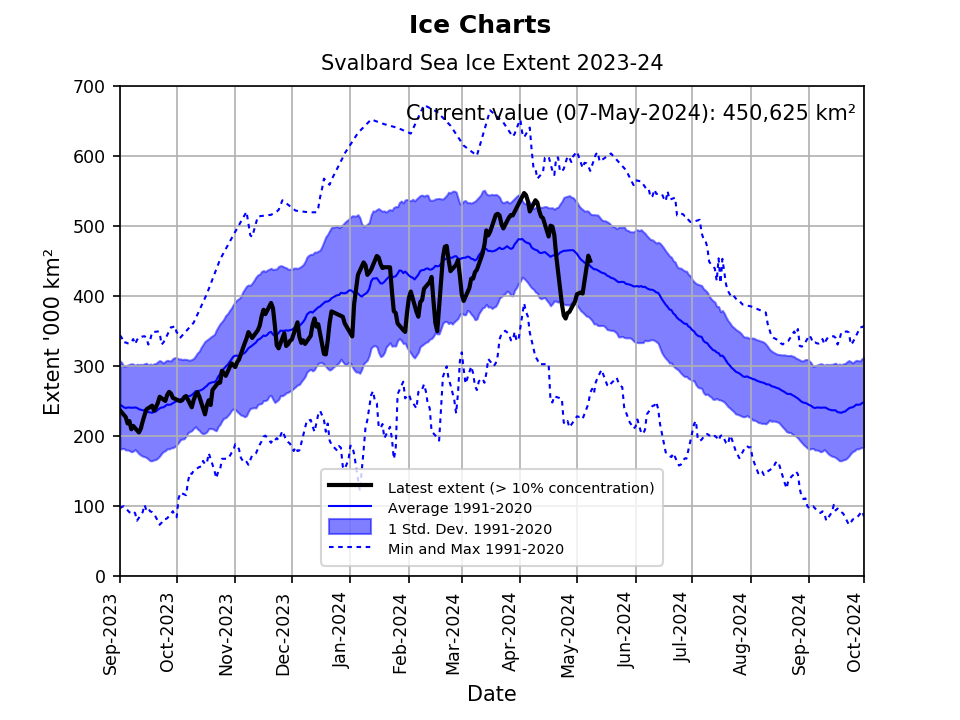
| Regional (Svalbard) sea-ice trackers | |
|---|---|
|
|
|
|
|
|
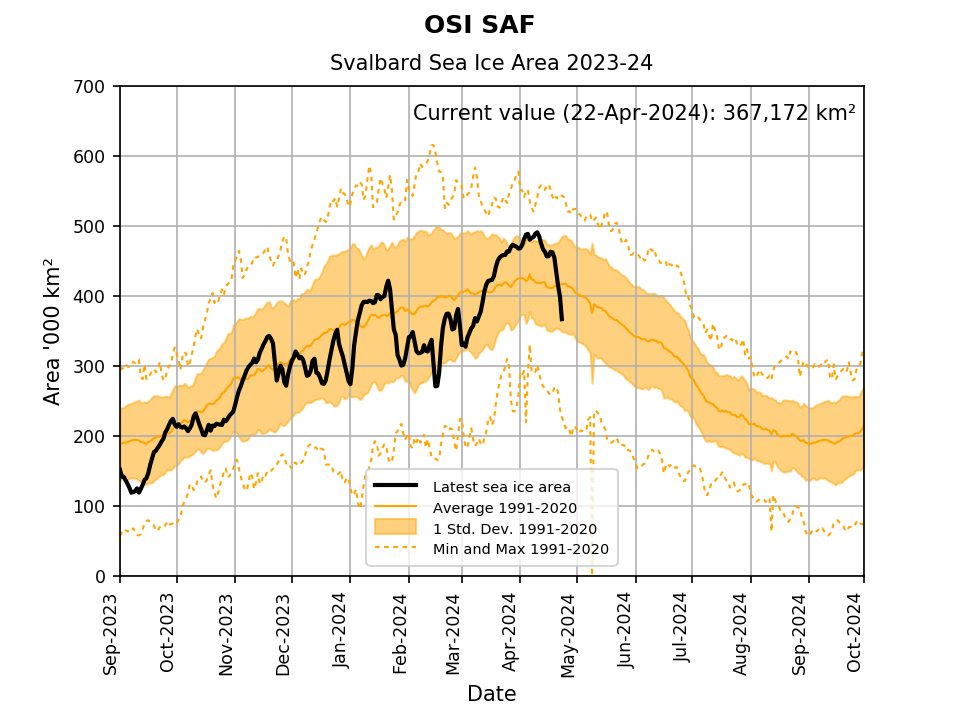
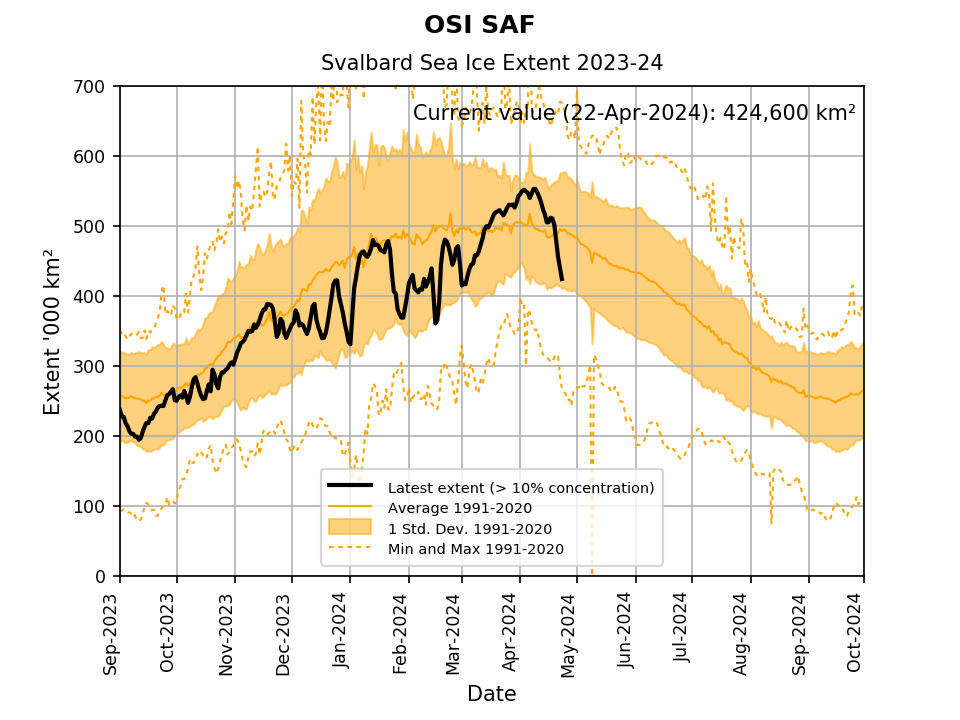
| Global sea-ice trackers (from EUMETSAT OSI SAF) | |
| Northern Hemisphere | Southern Hemisphere |
| Daily values | |
|
|
|
| All months since 1979 | |
|
|
|
| Trend for last month | |
|
|
|
| Trend for current month | |
|
|
|
| Rank of monthly sea ice extent | |
| Northern Hemisphere | Southern Hemisphere |
|
Sea-ice extent rank plot (link) Sea-ice area value plot (link) Sea-ice area rank plot (link) |
Sea-ice extent rank plot (link) Sea-ice area value plot (link) Sea-ice area rank plot (link) |
| Global | |
|
Sea-ice extent rank plot (link) Sea-ice area value plot (link) Sea-ice area rank plot (link) |
|


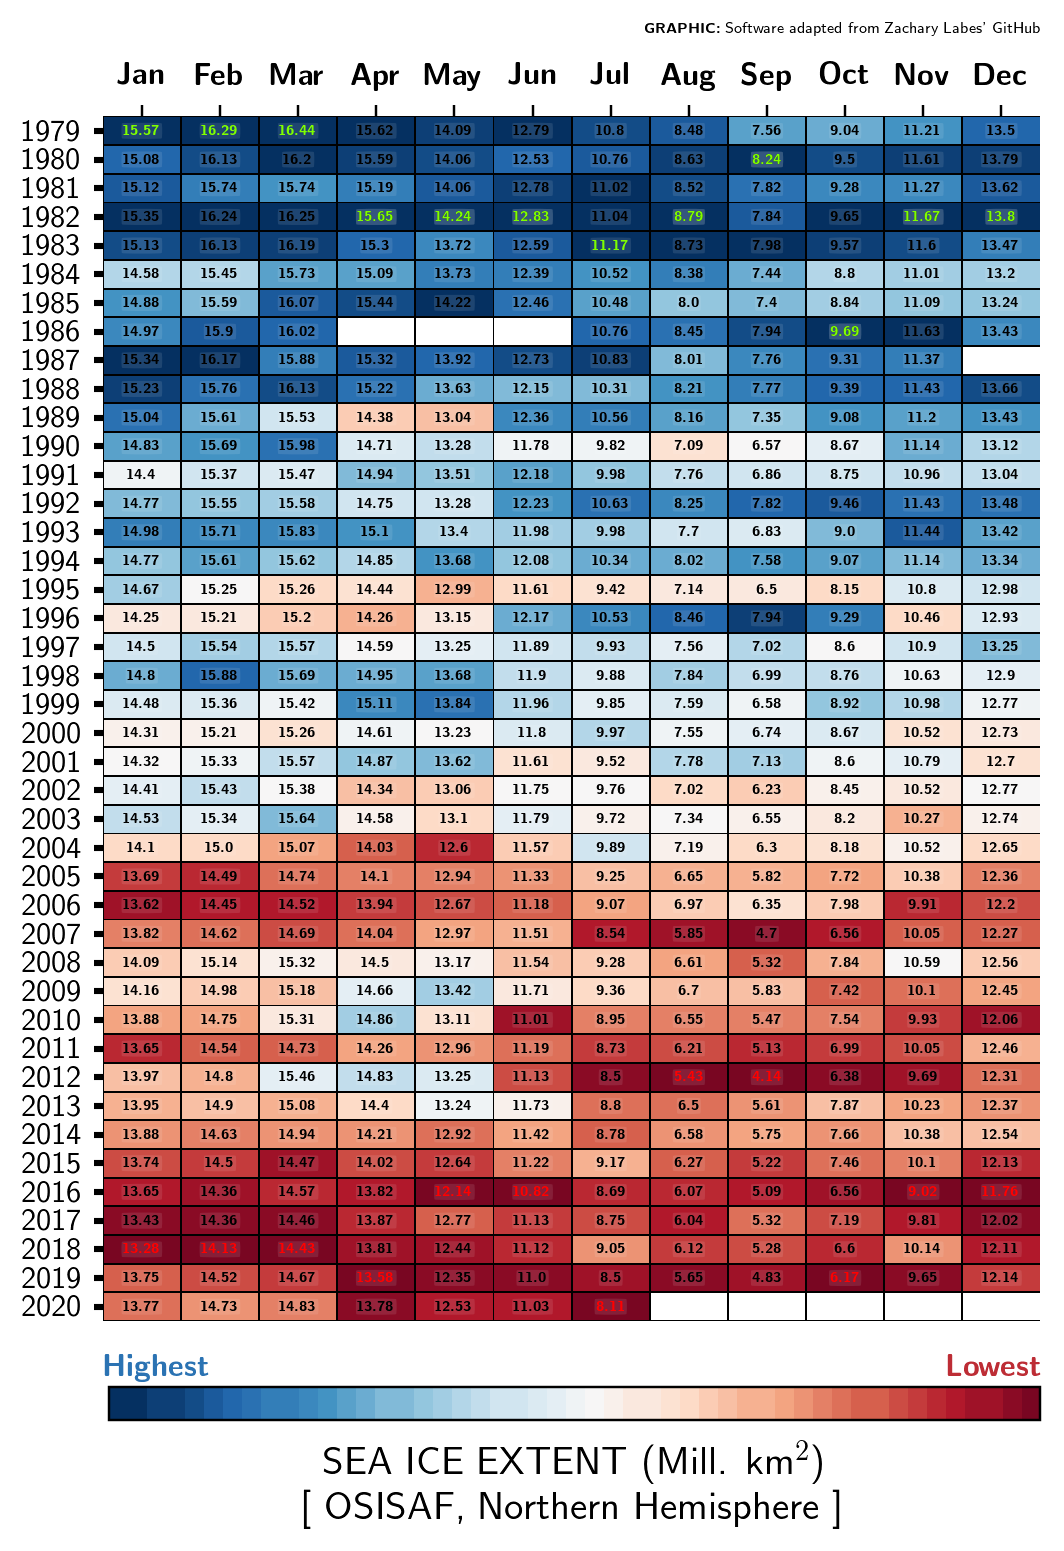
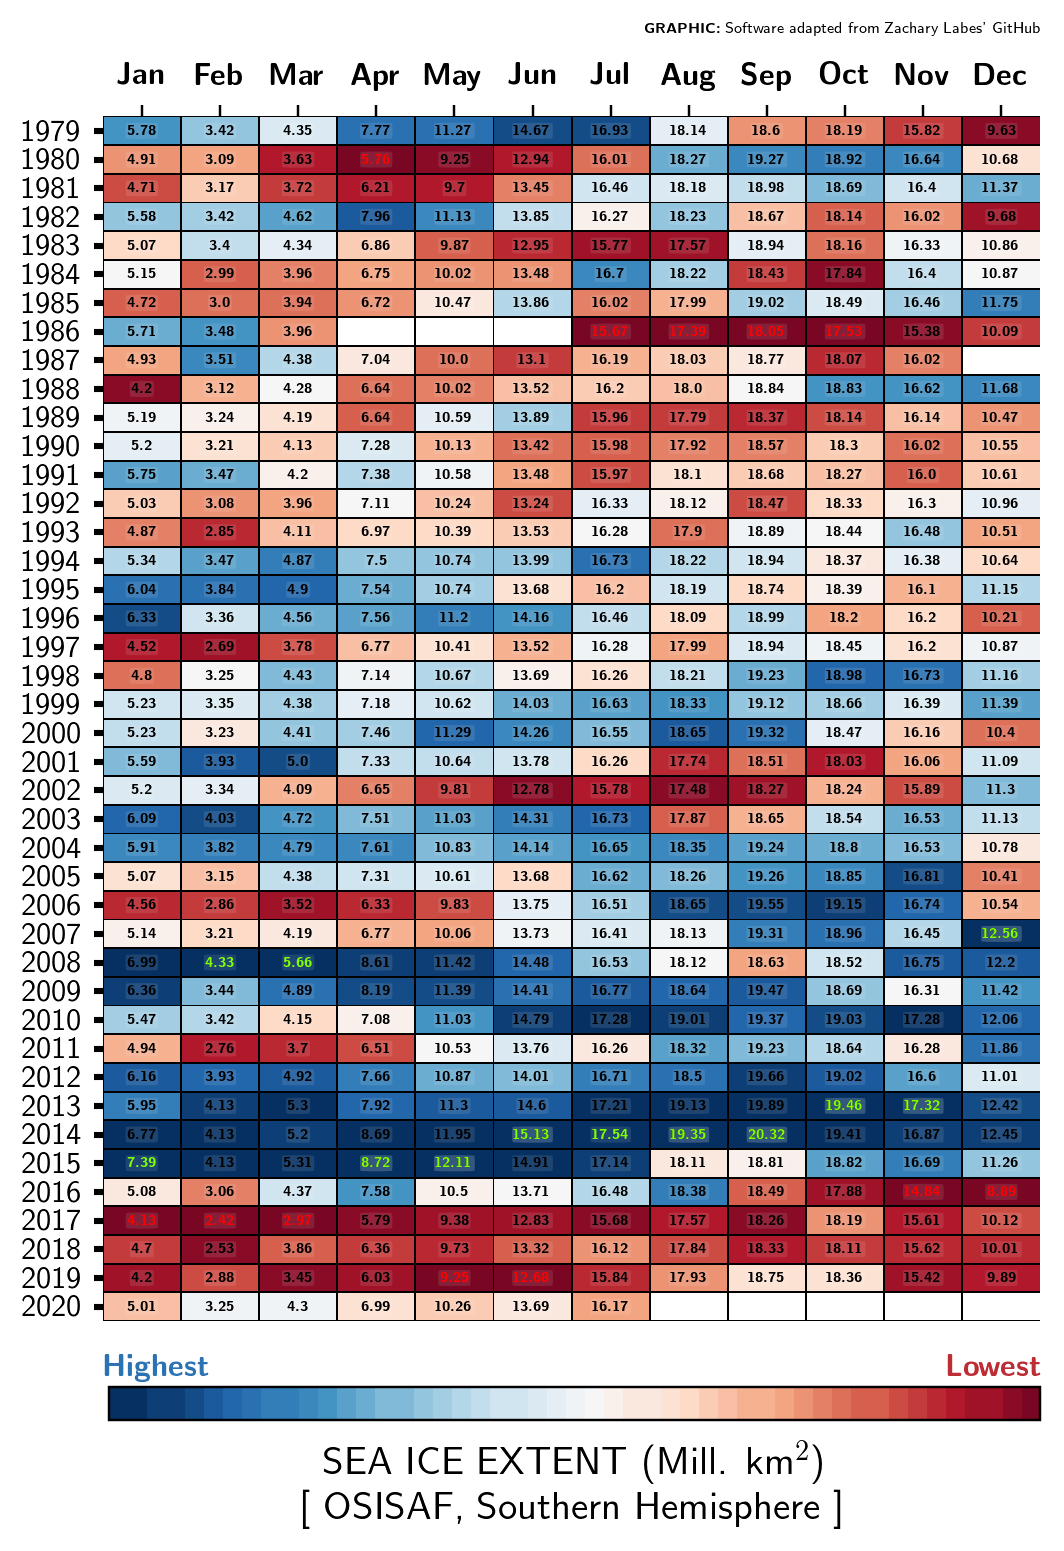
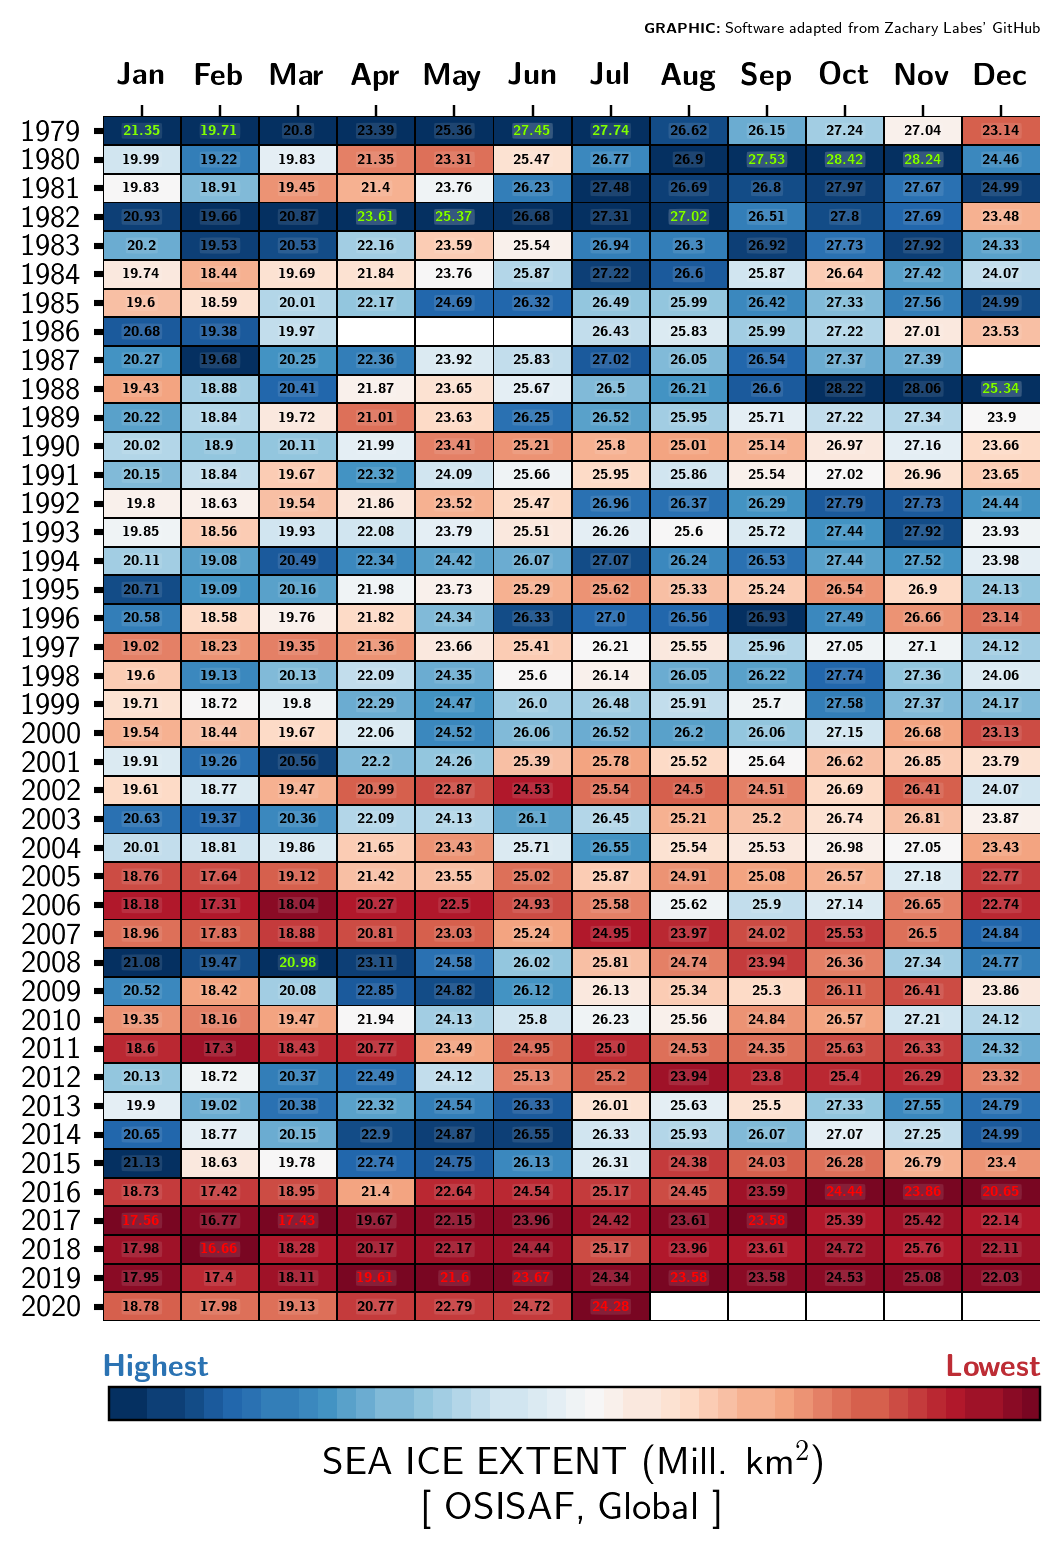
Sea ice is one of the iconic indicators of climate change. It is monitored routinely using satellite data since the late 1970s, although some earlier satellite observations exist, and ship observations and proxies can be used in some regions since as early as 1850.
On this page, we gather MET Norway’s contribution to monitoring sea-ice cover using a variety of satellite sources, that cover both global (Northern and Southern Hemispheres) and regional (Svalbard areas). Some of these plots are produced in operational services where MET Norway collaborates with other projects, such as the EUMETSAT OSI SAF, the EU CMEMS and C3S, ESA CCI, and for ice charts the U.S. NIC and Russian AARI.
Definitions
-
Sea Ice Concentration (SIC) is the fractional coverage of a grid cell that is covered with sea ice. It is also called sea-ice area fraction.
-
Sea Ice Extent (SIE) is the area of ocean that is covered with significant amount of sea ice. For the passive microwave data record, a commonly used definition is the area of ocean having more than 15% Sea Ice Concentration. For the ice charts, all detected sea-ice is accounted for. It has units km^2.
-
Sea Ice Area (SIA) is the area of ocean that is covered with sea ice, taking into account the SIC. It has units km^2 and is generally less than SIE. See also the relevant FAQ at NSIDC here.
-
Our climatological reference period is 1981-2010.
Input Data
Sea-ice concentration data used in our sea-ice indicators are from two sources:
-
The archive of navigational sea-ice charts at MET Norway, dating back to 1967, and covering the European Arctic domain. An area around Svalbard (0 – 40°E, 72 – 85°N) is extracted to build the indicators shown here.
-
The EUMETSAT OSI SAF SIC data records, dating back to 1979, and covering both polar regions. The indicator combines Climate Data Records (CDRs), Interim CDRs, and operational data.