
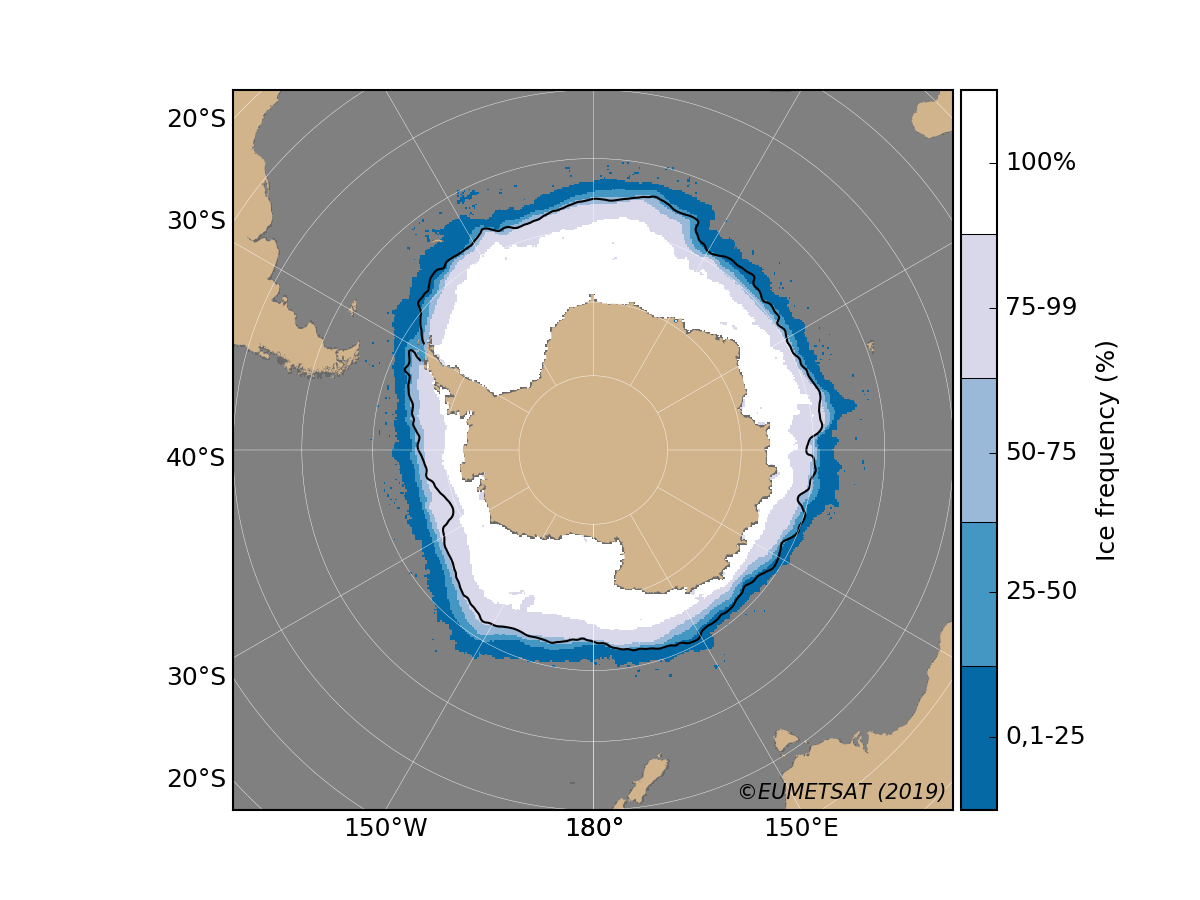
September is typically the month with least sea ice in the Arctic, and with most sea ice in the Antarctic. How did the sea ice behave this summer? We take a look back.
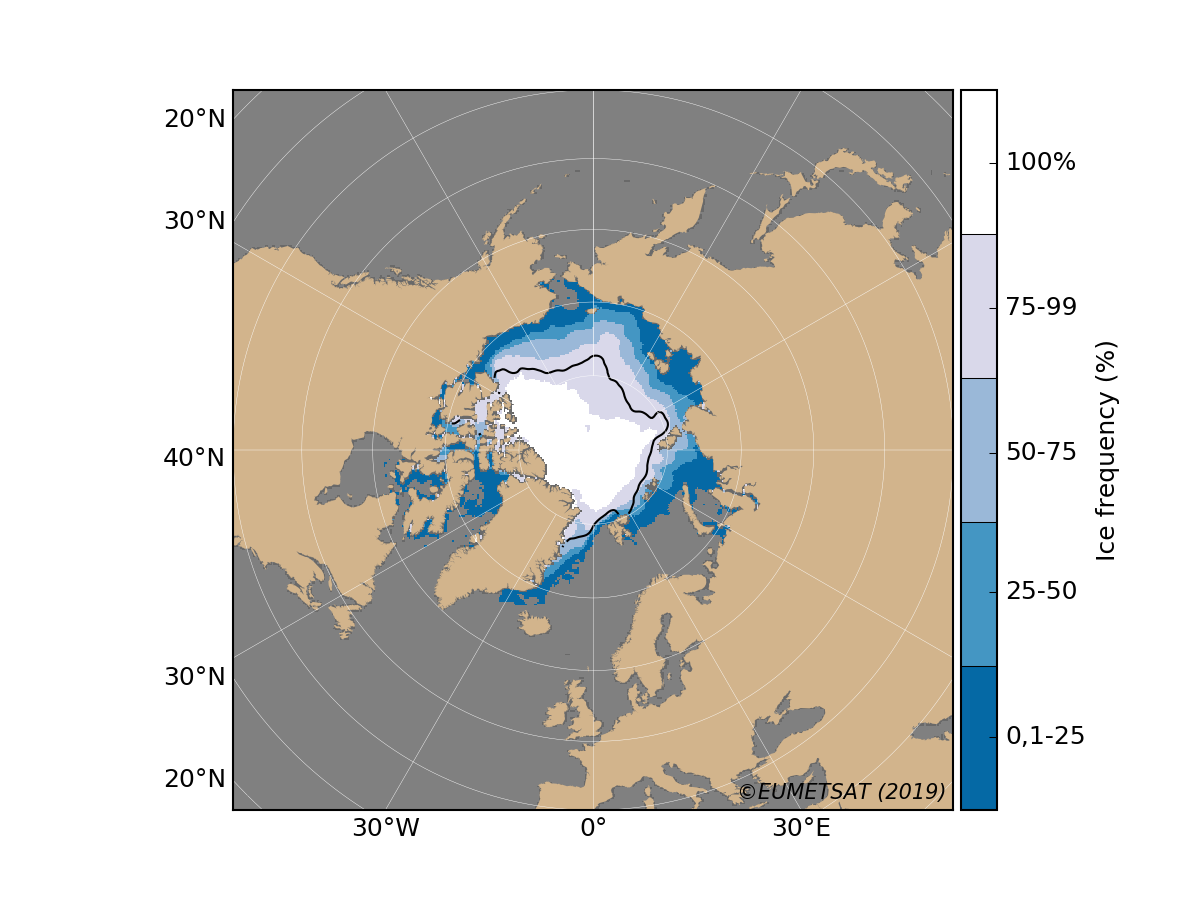
The map above shows the frequency of how often sea ice with a certain concentration (here more than 30% ice concentration) is observed for September in a 30 year period from 1981 to 2010. The white area in the middle of the Arctic Ocean defines the most stable ice cover where ice was observed through the entire period while in the dark blue regions furthest to the south sea ice in September has occurred less than 25% of the period. The black line in the map represents the September sea-ice extent this year and clearly shows a smaller extent than the 30 years average. An exception to this is in the region north of Svalbard where sea ice this summer was pressed toward the northern coast and the ice cover was larger than normal.
At MET Norway information on the sea ice conditions is updated on a daily basis. An example is seen in https://cryo.met.no/en/arctic-melt-2019 where the figure clearly shows that the Arctic sea-ice extent in September 2019 was one of the lowest within the last 40 years. More sea-ice climate indicators are found on https://cryo.met.no/en/sea-ice-climate-indicator
For comparison, the September sea-ice extent in Antarctic this year was to a large extent comparable with the 30 years average extent.
Fact Box
Sea ice concentration is a parameter used to describe how densely the sea ice is packed. It is expressed by a continuous scale from completely compact ice (100%) to an open ocean with no ice (0%). When studying the sea-ice extent it is common practice to define a threshold for concentration that divides the surface into “ice” and “no-ice”. In the figures above is used a threshold of 30% concentration. In other studies you will find e.g. 15% to define sea-ice extent.