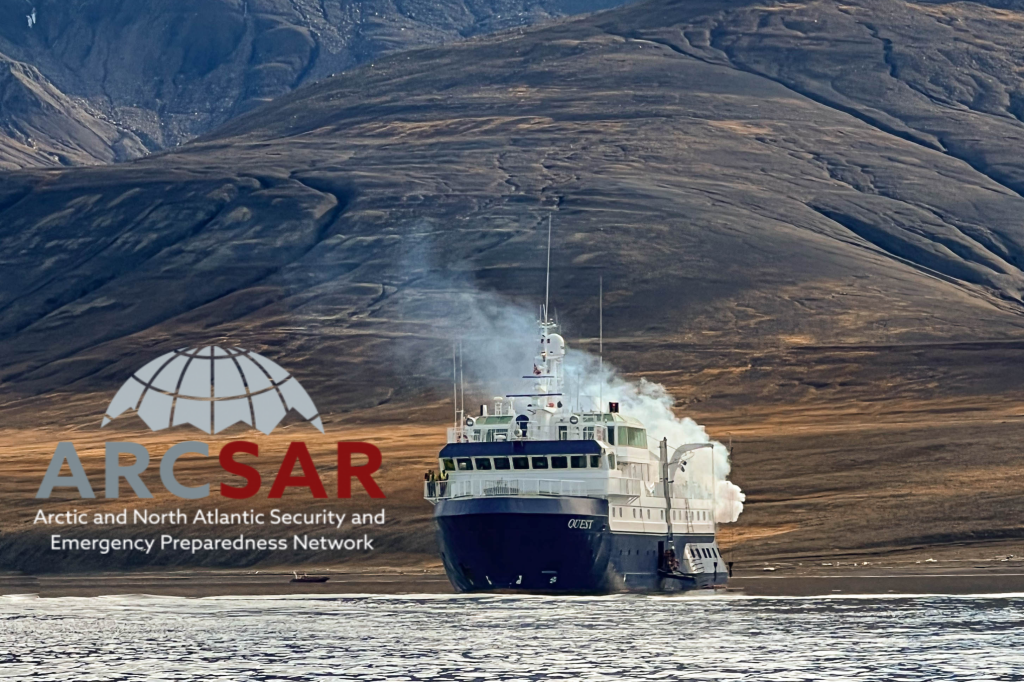
 From August 28th to September 1st 2022, a team from værvarslinga in Tromsø took part in the ARCSAR (Arctic and North Atlantic Security and Emergency Preparedness Network) project ‘LIVEX’ event in Svalbard.”

News
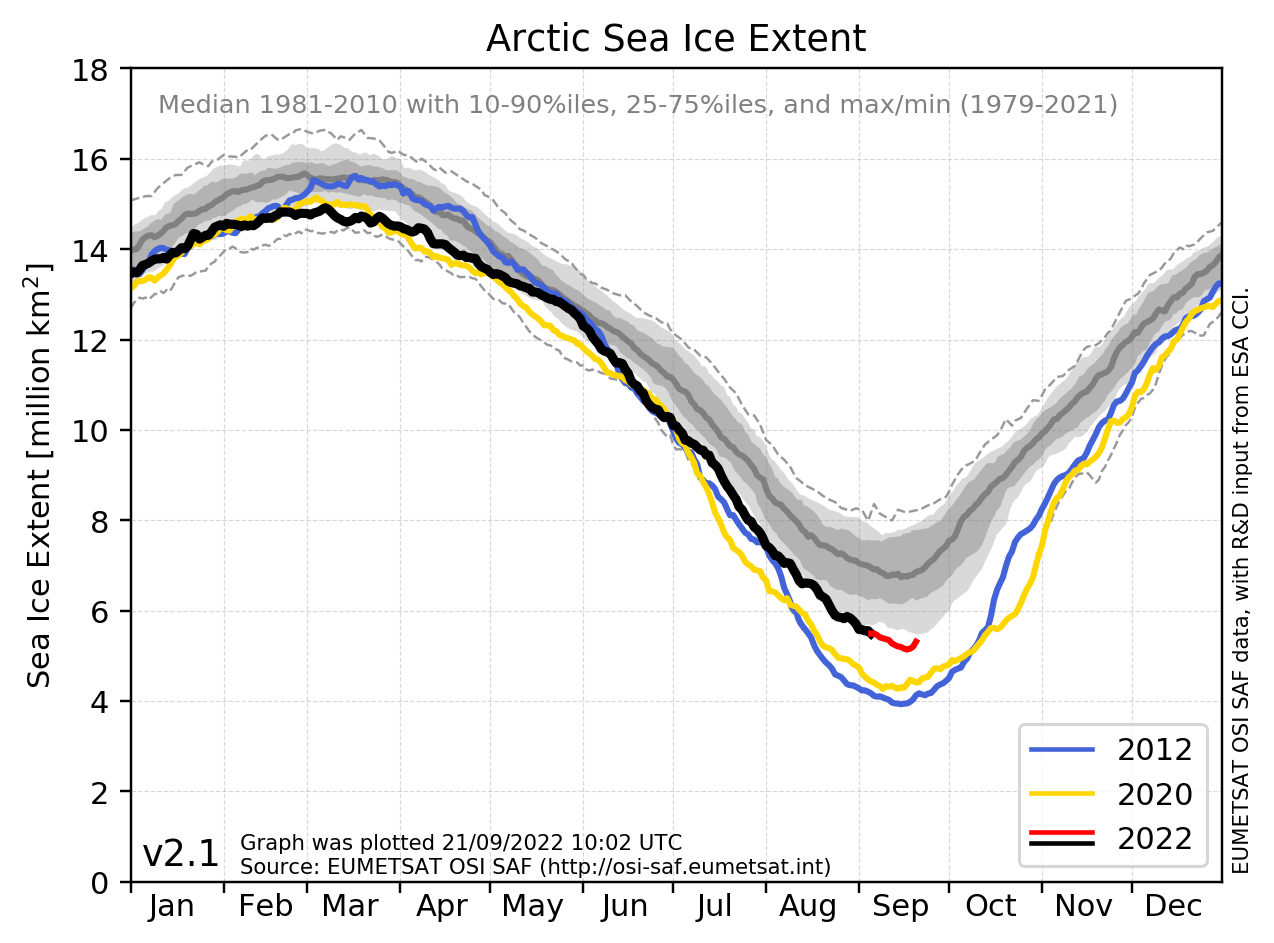 The sea ice in both the Arctic and Antarctic stands out this year as having ice extents among the top ten lowest on record. In the Arctic, the annual minimum ice extent has just been recorded as the ninth lowest since measurements began more than 40 years ago. In Antarctica, where winter is now over, the annual maximum extent is the seventh lowest on record.
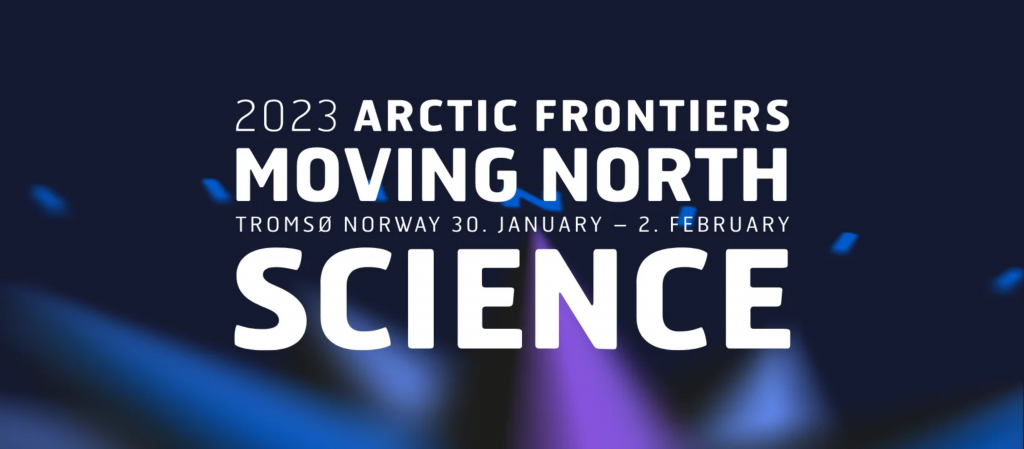 The Norwegian ice service will be leading session 3 of the Arctic Frontiers Conference in late January / early February 2023, “Modelling and monitoring challenges to maritime safety in a changing Arctic.”
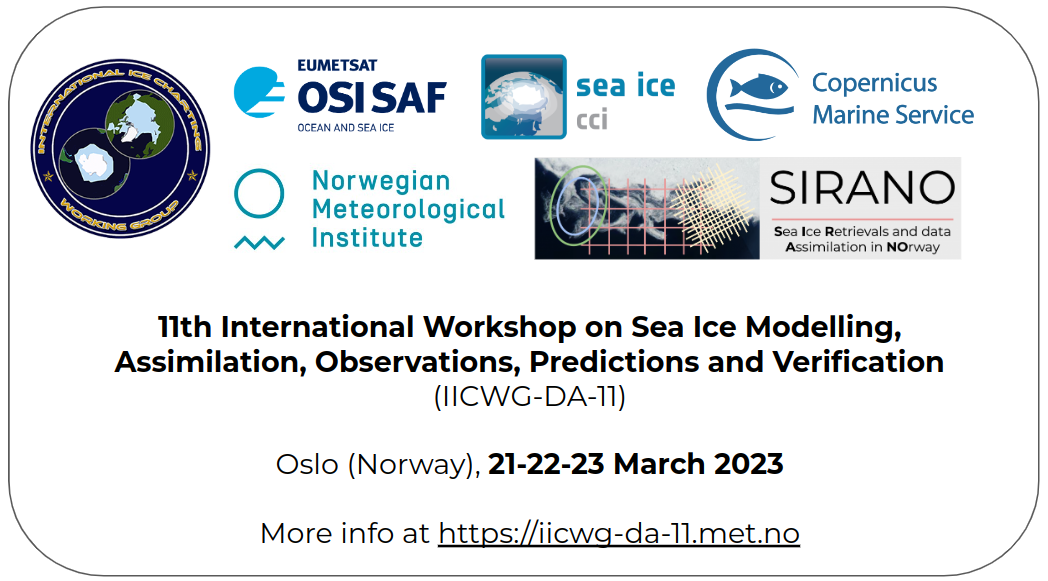 We welcome you in Oslo for the IICWG-DA-11 sea-ice workshop 21-22-23 March 2023 ! Find more information at https://iicwg-da-11.met.no.
![]() Scientists from our cryosphere team at MET Norway are participating in the Living Planet Symposium 2022, LPS22, which is among the biggest Earth Observation conferences in the world. See some of our contributions here.
Scientists from our cryosphere team at MET Norway are participating in the Living Planet Symposium 2022, LPS22, which is among the biggest Earth Observation conferences in the world. See some of our contributions here.
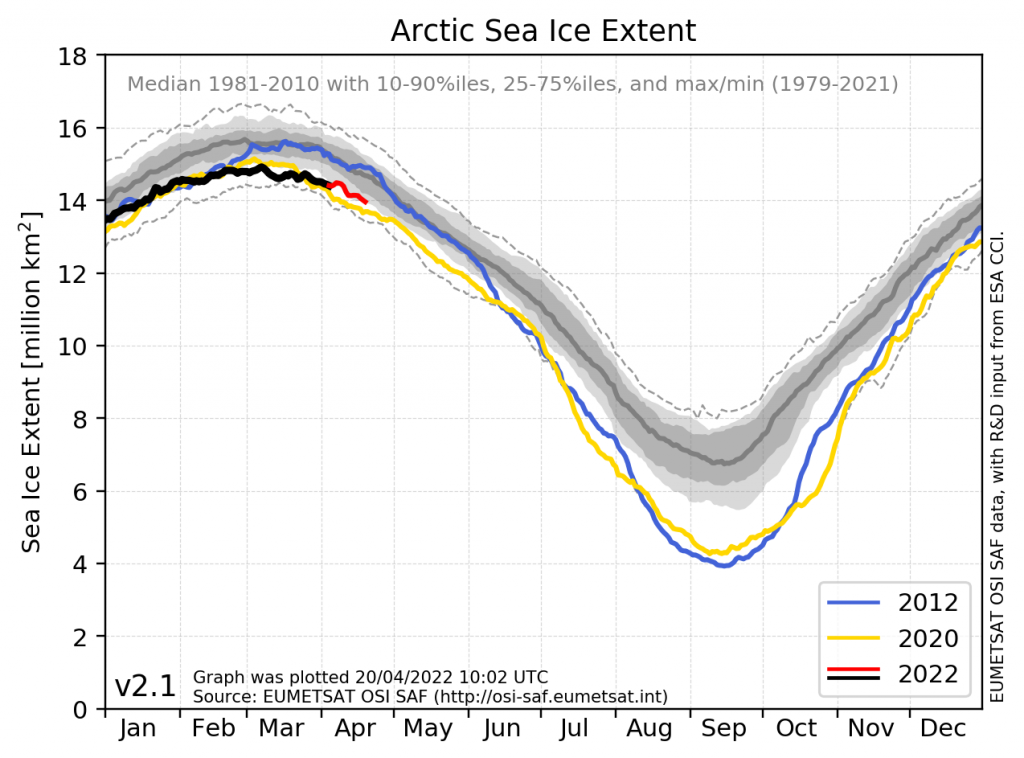 The yearly sea-ice maximum in the Arctic and minimum in the Antarctic occur in the period of February and March. With satellite data processed at the Norwegian Meteorological Institute, the status of the sea-ice extrema this spring will be summarised here.
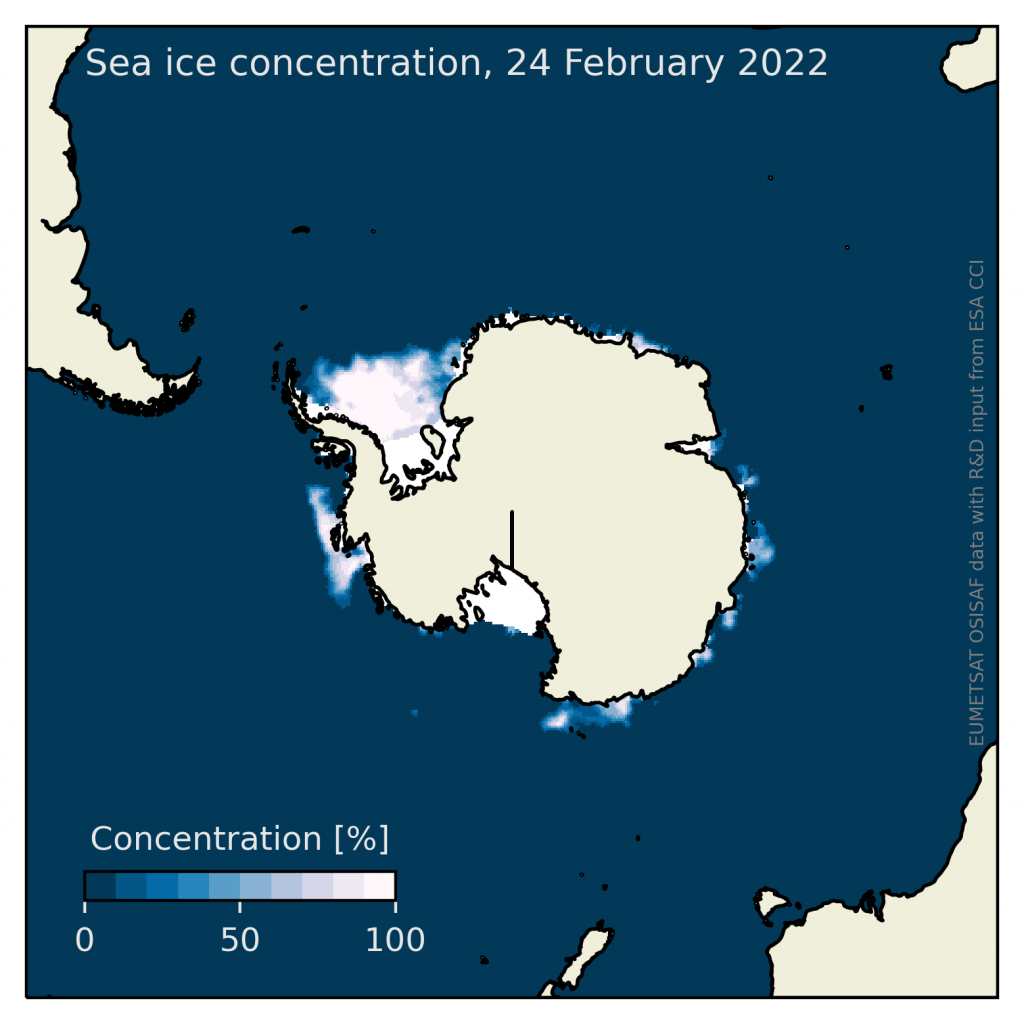 Seasonal minimum of the Antarctic sea ice reached record-low values in February. Especially the Ross Sea experienced very little ice by the end of the summer period.
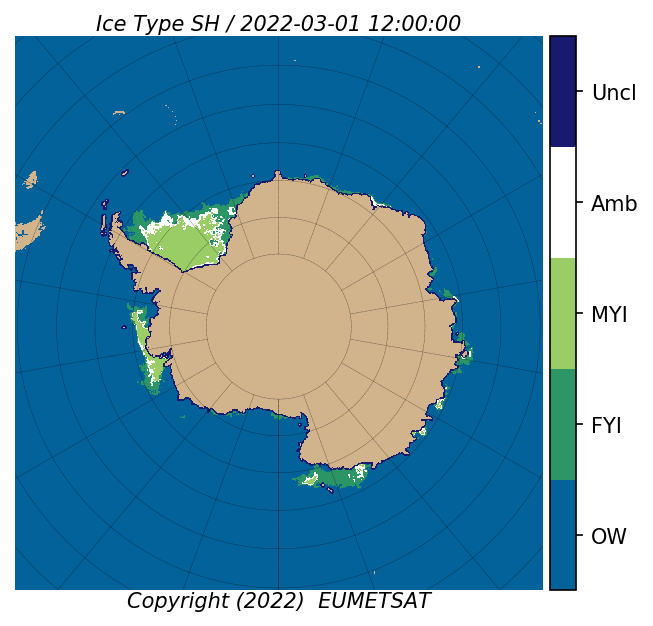 Last year, we released for the first time a new product mapping the sea-ice type in the Southern Hemisphere. The ice type classification is provided daily in the Antarctic winter period, and March 1st is the first classification of a new winter season.
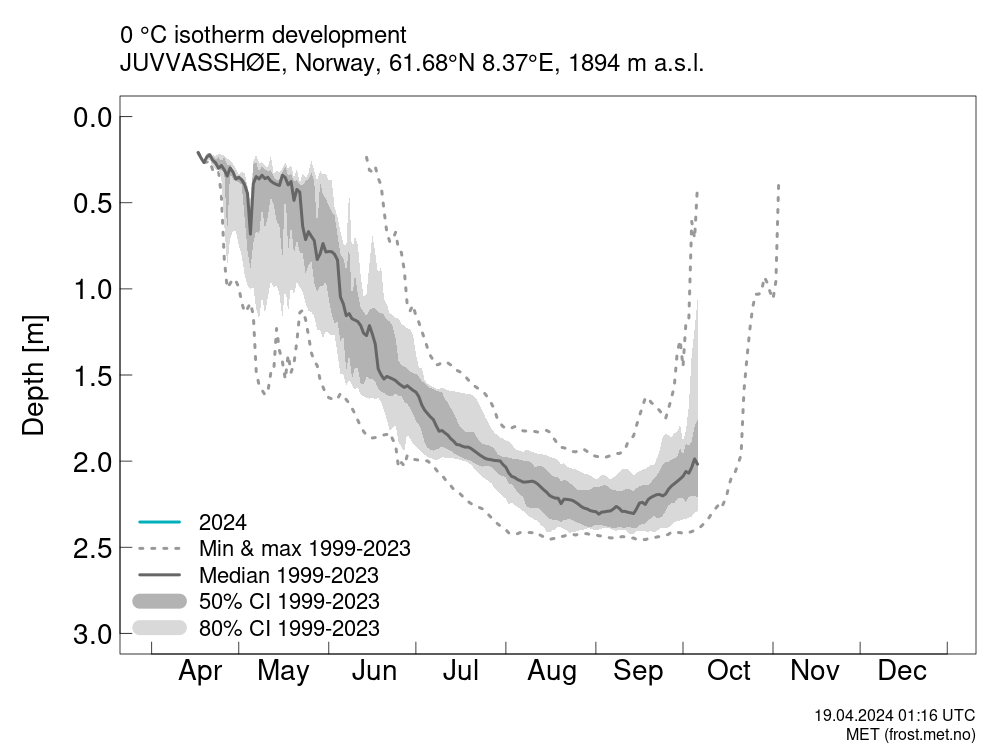 Recently, we have developed new products at cryo.met.no that show real-time permafrost temperature data from operational monitoring sites in Svalbard and Norway.
 We have an available 3-years position as researcher / scientific programmer!
Closing date October 15, 2021!
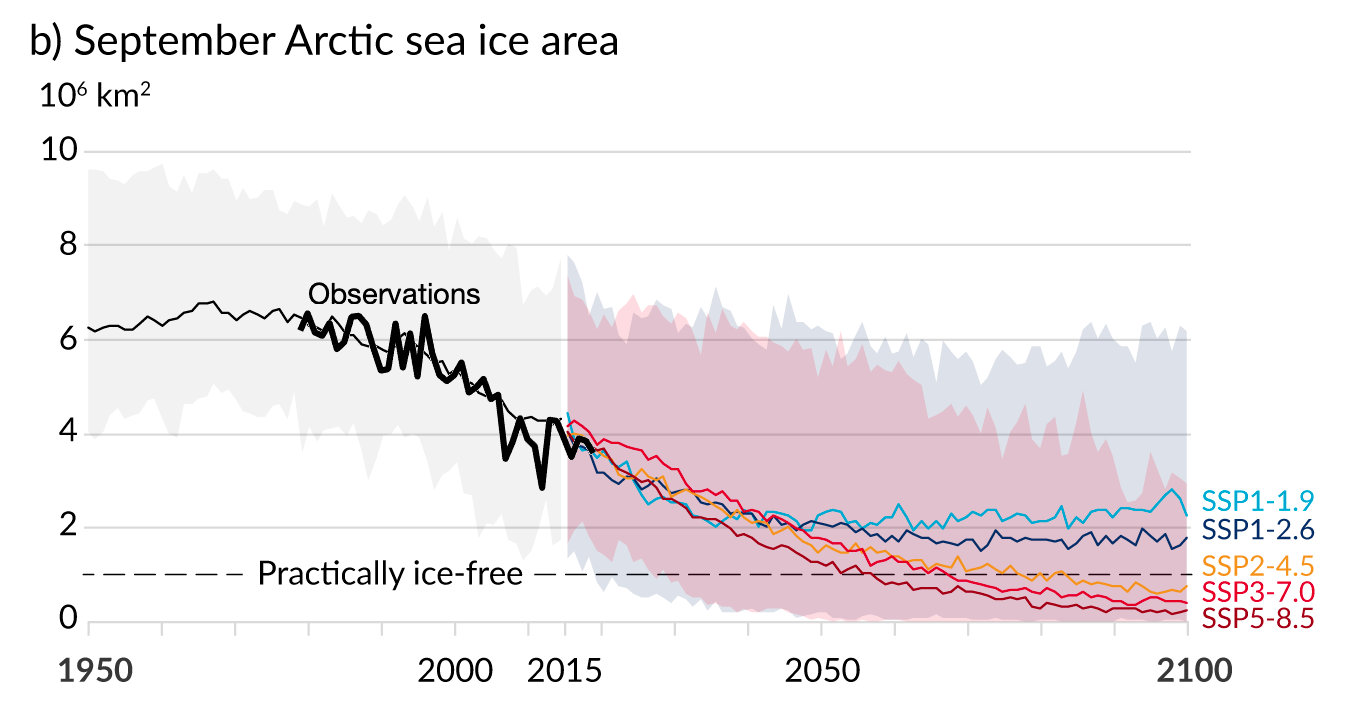
We are proud that our sea ice data were used in the 6th IPCC Assessment Report (AR6) that was released early this August!
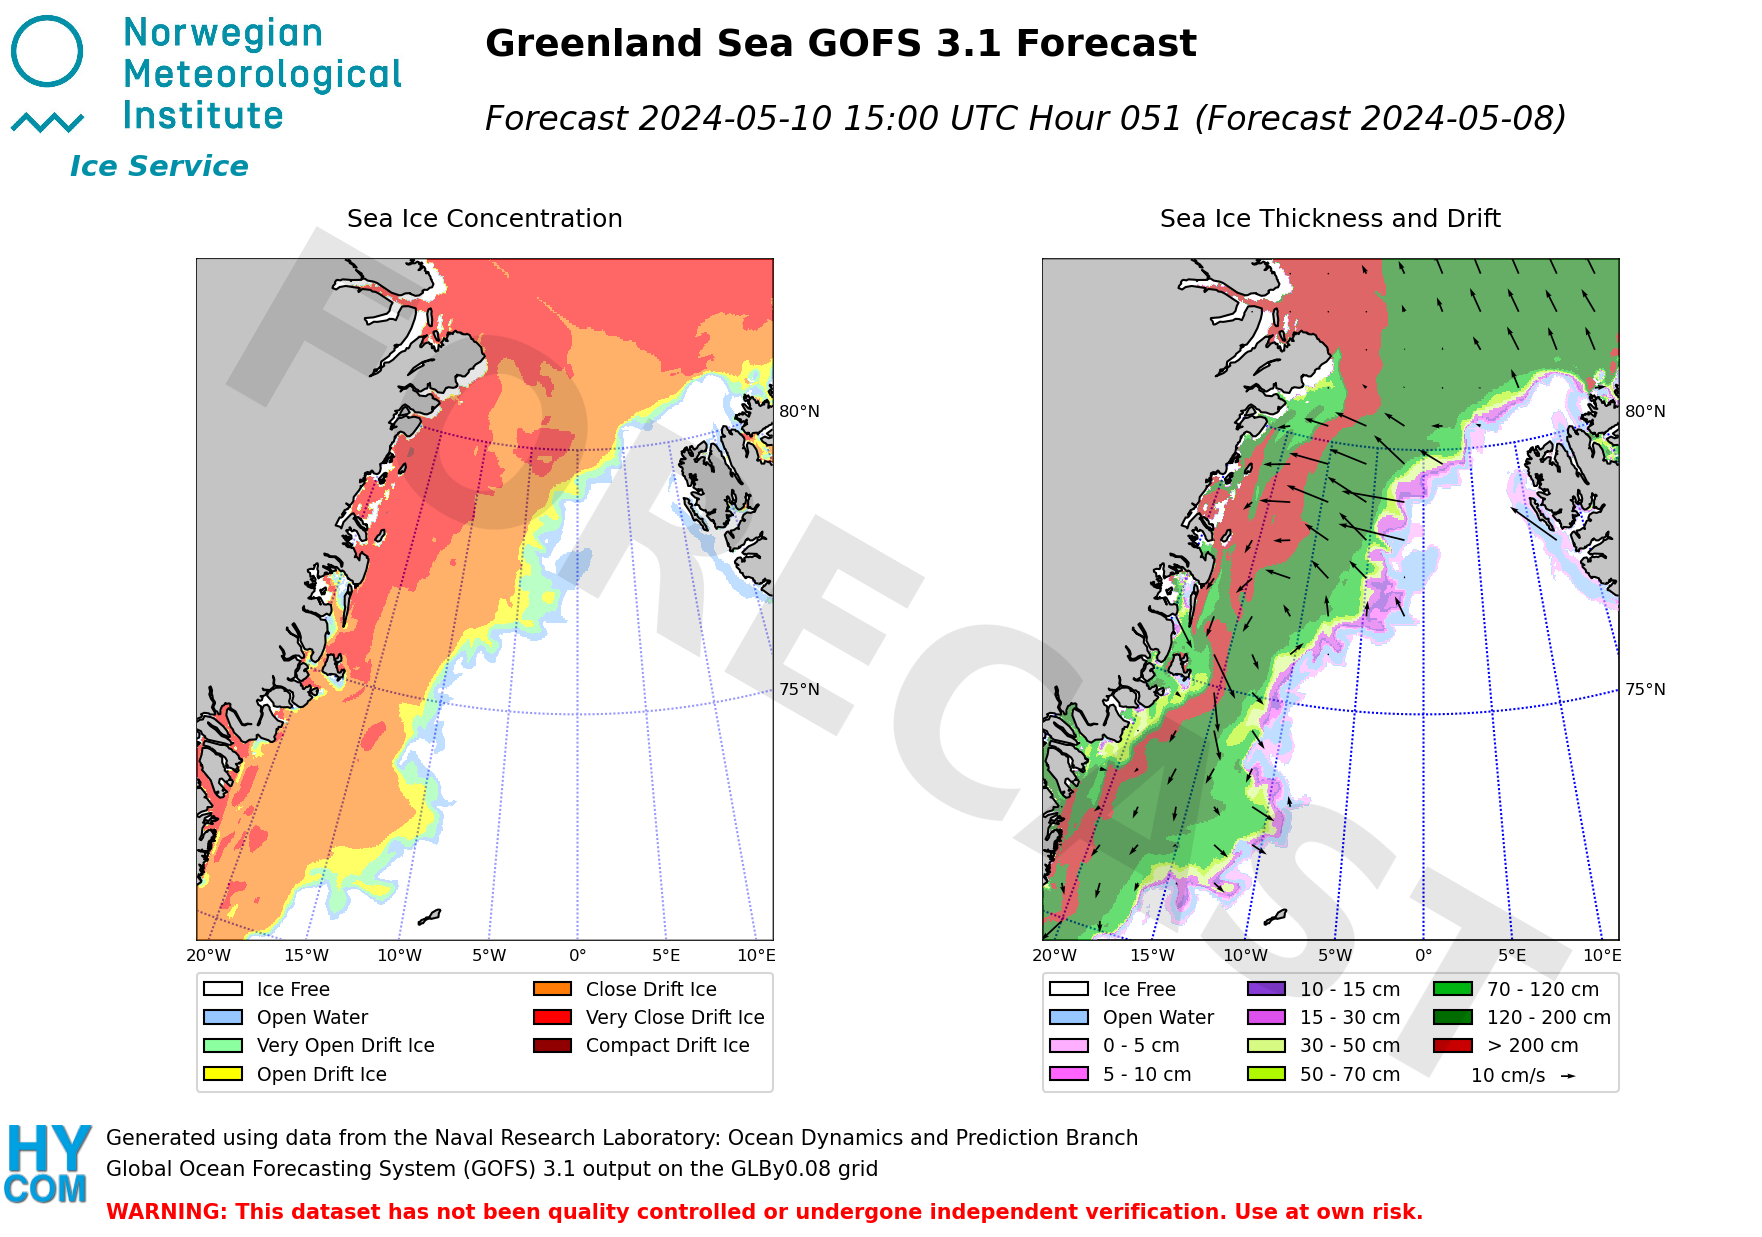
We’re pleased to announce the availability of our visualisations from a number of short-range sea ice forecasts for the Greenland Sea and Fram Strait. These provide maps of estimated sea ice concentration, thickness, and drift at 24 forecast intervals, and animations for the whole forecast period, up to 6 days ahead. The new page also provides a comparison of the forecasts for predicted distance and direction of the sea ice edge from near Jan Mayen island.
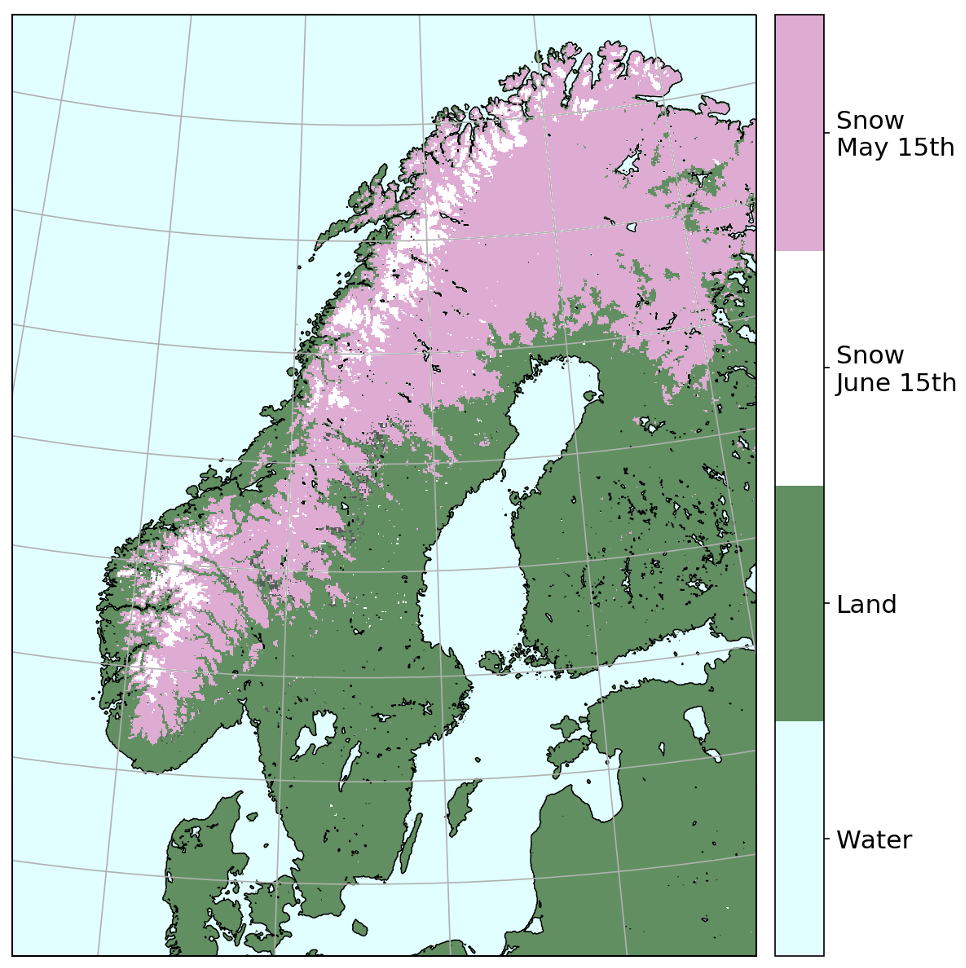 Summer is approaching fast. During the last month snow covering approximately 150 000 square kilometers of land has melted, as the total snow-covered area for Mainland Norway has gone from 60% to 10%.
 Don’t miss the chance to hear our research scientists talk about the cryosphere this month.
The Polar Expert Group of the European Commission has published the 3rd of it's "User Requirements for a Copernicus Polar Observing System" reports. This report, subtitled "Phase 3 Report - Towards Operational Products and Services", incorporates recommendations from the KEPLER project led by MET.
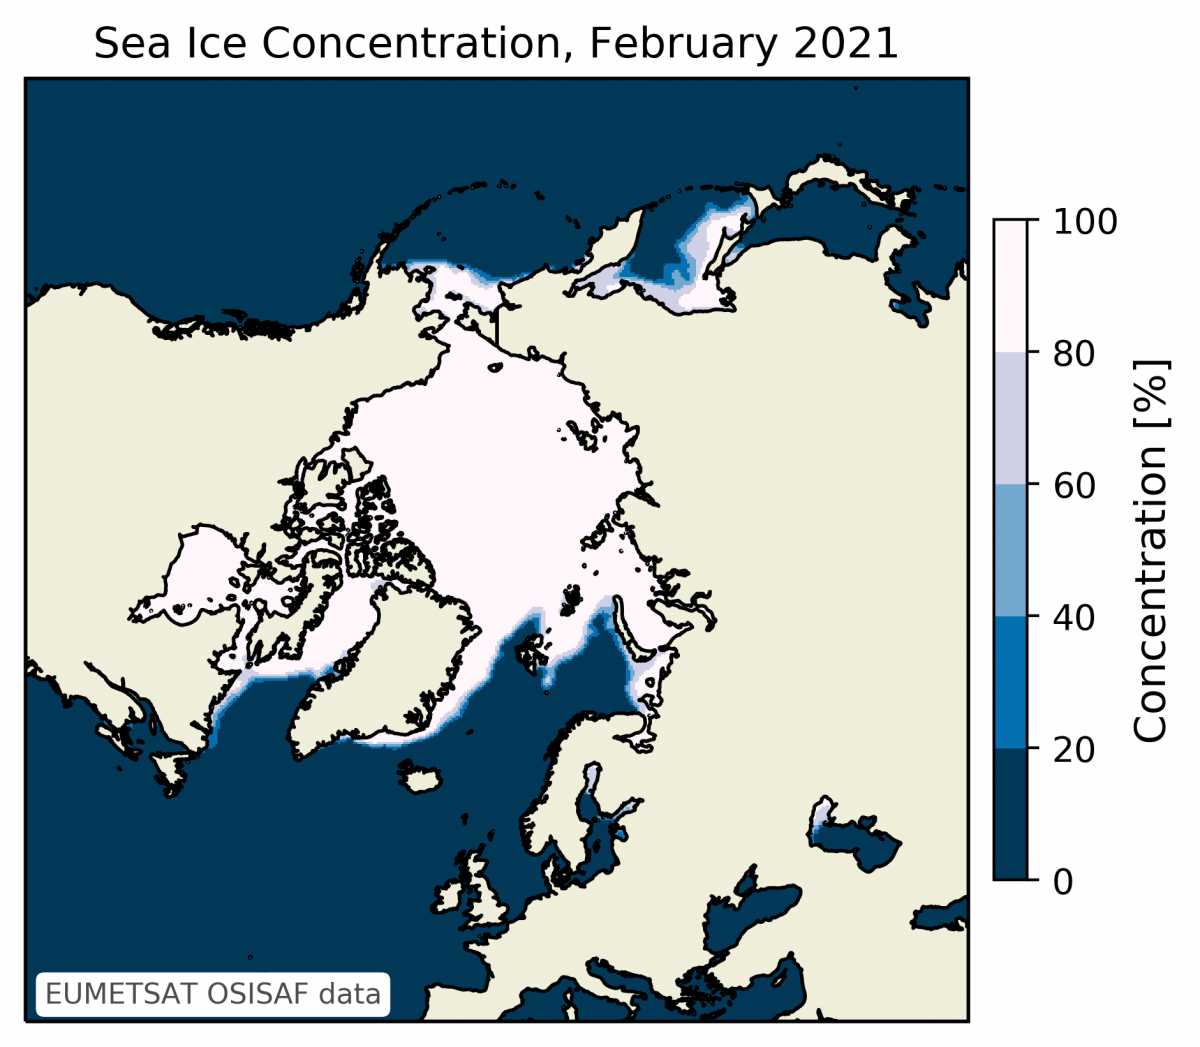 The yearly maximum (in the Arctic) and minimum (in the Antarctic) sea-ice extent occurs in February/March. With satellite data processed at the Norwegian Meteorological Institute, the status of the sea-ice extrema this spring is summarised.
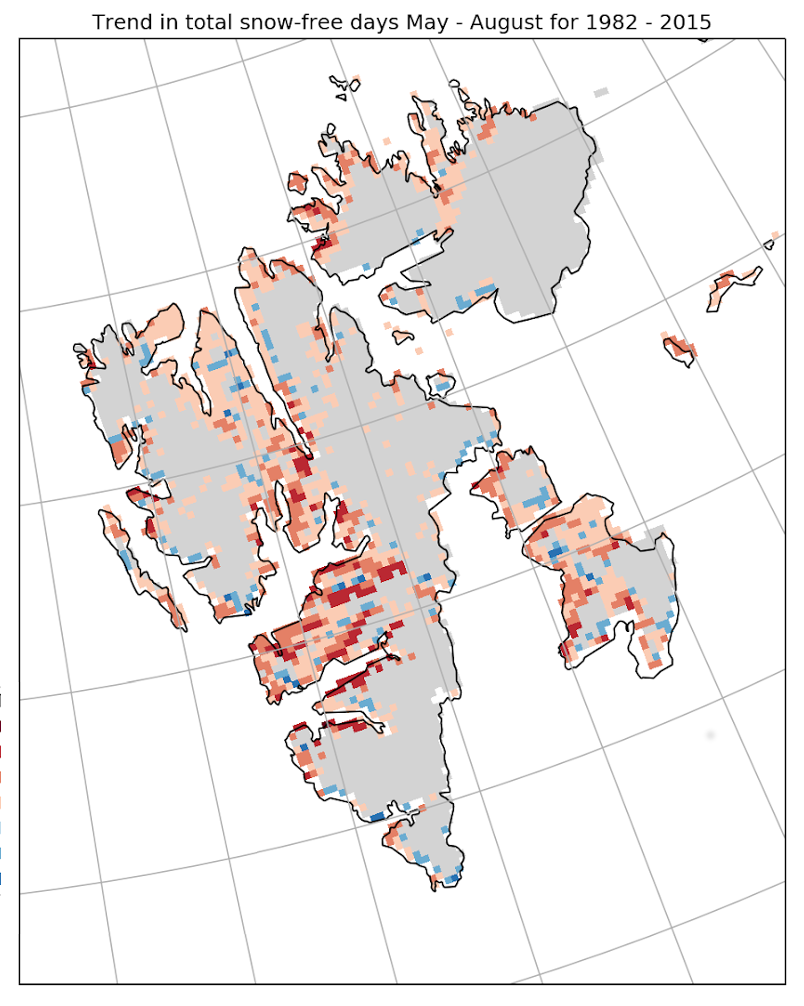 Satellite monitoring over 1982-2015 shows earlier onset of snow melt on Svalbard. The most pronounced shift is in valleys, where the ground is snow-free 1-2 days more every year during summer. Snow cover variability in lowlands correlates with the variability of sea ice in the adjacent seas, especially in June.
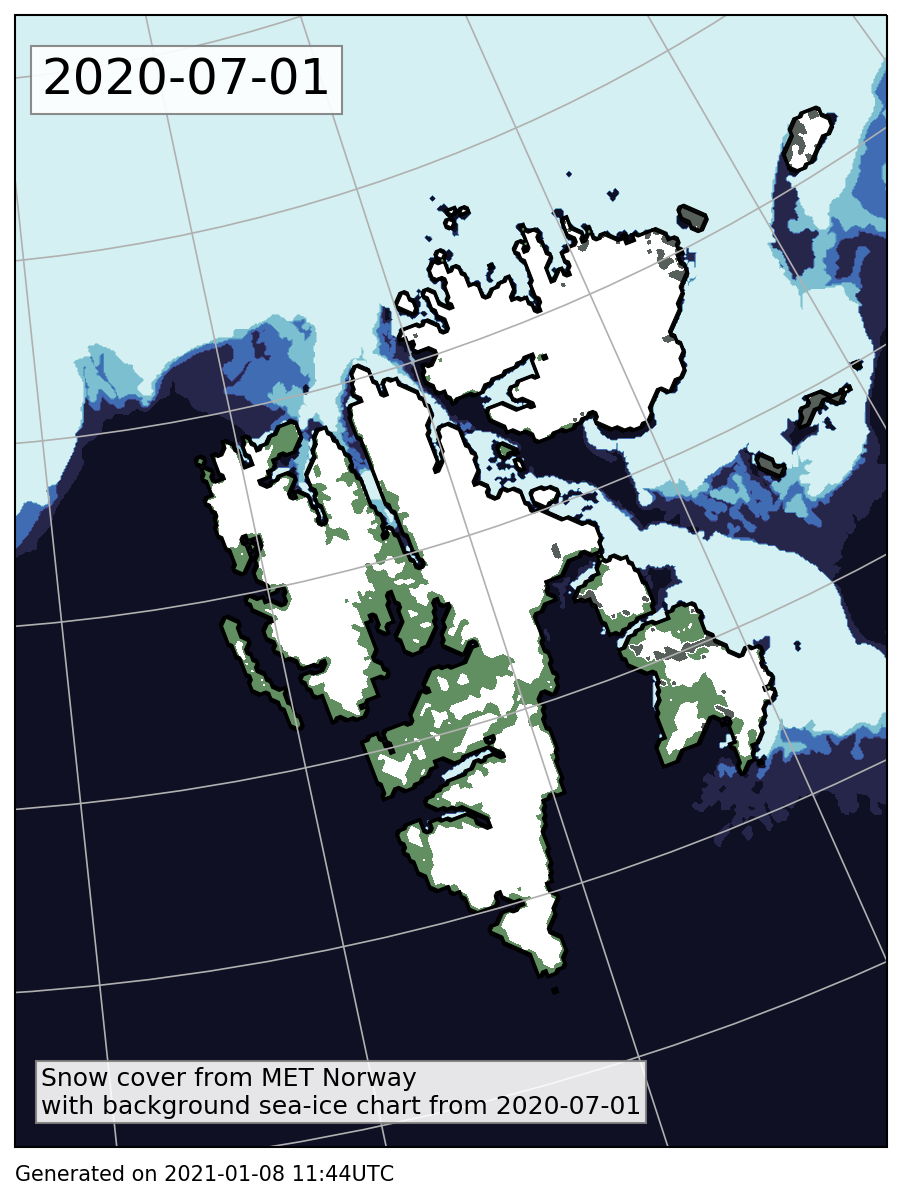 2020 was the warmest year on record for Norway since the temperature measurements began more than 120 years ago. For Svalbard, although not beating the record from 2016, 2020 was also a warm year with the warmest summer in the 121-year record for Svalbard Airport. The Norwegian Meteorological Institute conducts in-situ measurements and remote sensing observations of the cryosphere: terrestrial snow cover, permafrost and sea ice. What types of cryospheric observations are available on cryo.met.no for the Svalbard area, and what characterized these for 2020?
 2020 holds the second-lowest sea-ice extent on record in the Arctic, following the record-low in 2012. Therefore we update our daily Arctic sea-ice extent figure which includes the two recent years with the lowest sea-ice extent as reference curves.
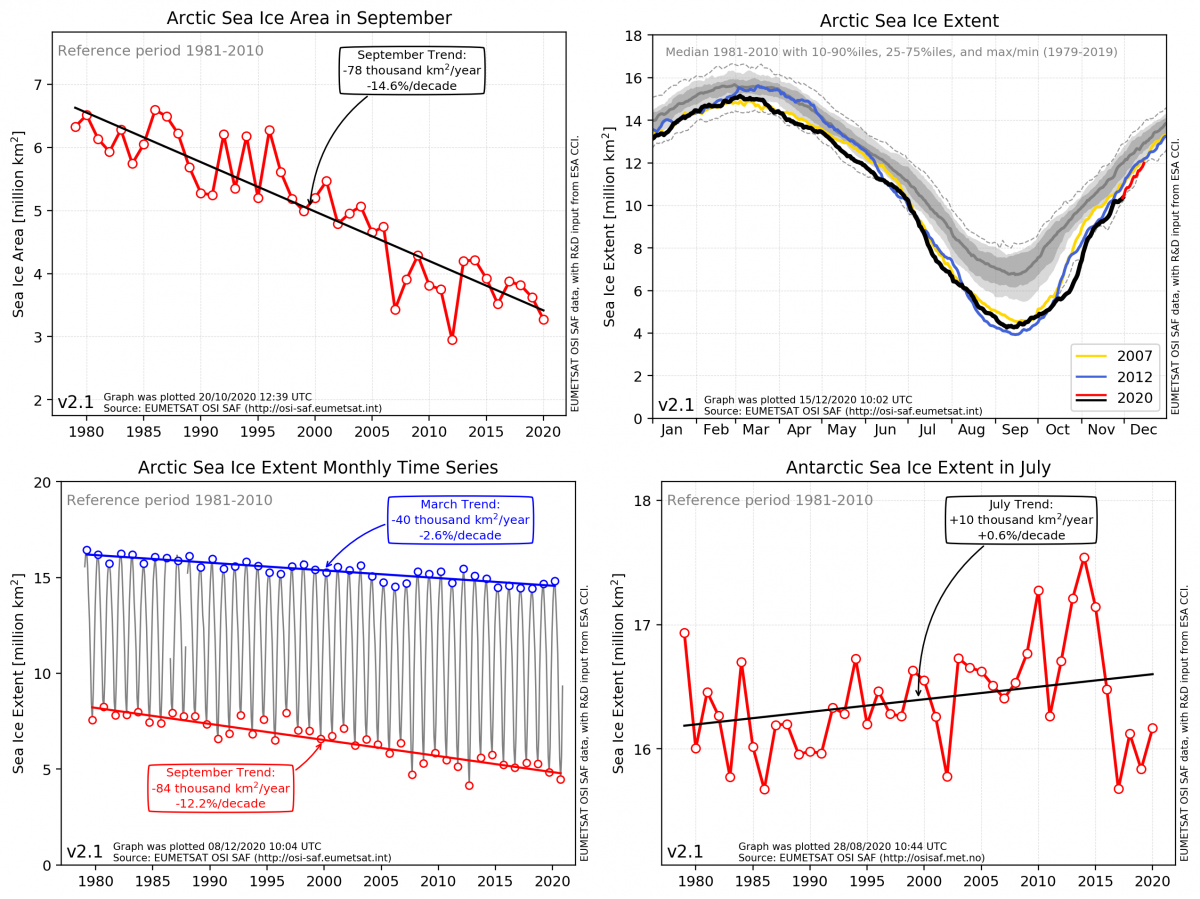 On behalf of the OSI SAF sea-ice team, we are happy to present the new OSI SAF Sea Ice Index v2.1. The index consists of both the sea-ice extent and sea-ice area information and is provided as global, hemispheric, and regional data.
![]() Over the last six months, we have received many contributions through Ice Watch and testing of our new mobile application IceWatchApp. In total, the database consists of close to 10 000 individual sea ice observations from research, operations and polar tourism cruises in remote polar waters. To name a few vessels we currently have in our Ice Watch database; RV Kronprins Haakon, KV Svalbard, HI Sverdrup, Polarstern and Akademik Fedorov.
Over the last six months, we have received many contributions through Ice Watch and testing of our new mobile application IceWatchApp. In total, the database consists of close to 10 000 individual sea ice observations from research, operations and polar tourism cruises in remote polar waters. To name a few vessels we currently have in our Ice Watch database; RV Kronprins Haakon, KV Svalbard, HI Sverdrup, Polarstern and Akademik Fedorov.
 As with many aspects of our lives, the KEPLER project has been highly impacted by the COVID-19 pandemic. All events requiring physical presence of the participants have been postponed to a later date with many of them switched to an online teleconference format. However, when it comes to deliverables and recommendations, the pandemic has had less impact. The KEPLER project is being coordinated by Nick Hughes, the leader of the Norwegian Ice Service in MET Norway.
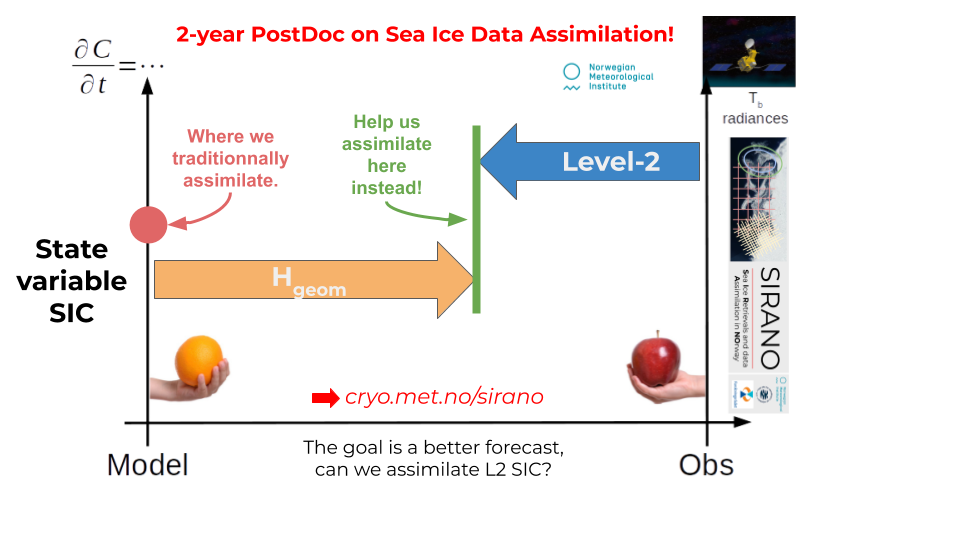 We are recruiting in a 2-year PostDoc position on Sea Ice Data Assimilation!
Closing date 23 November!
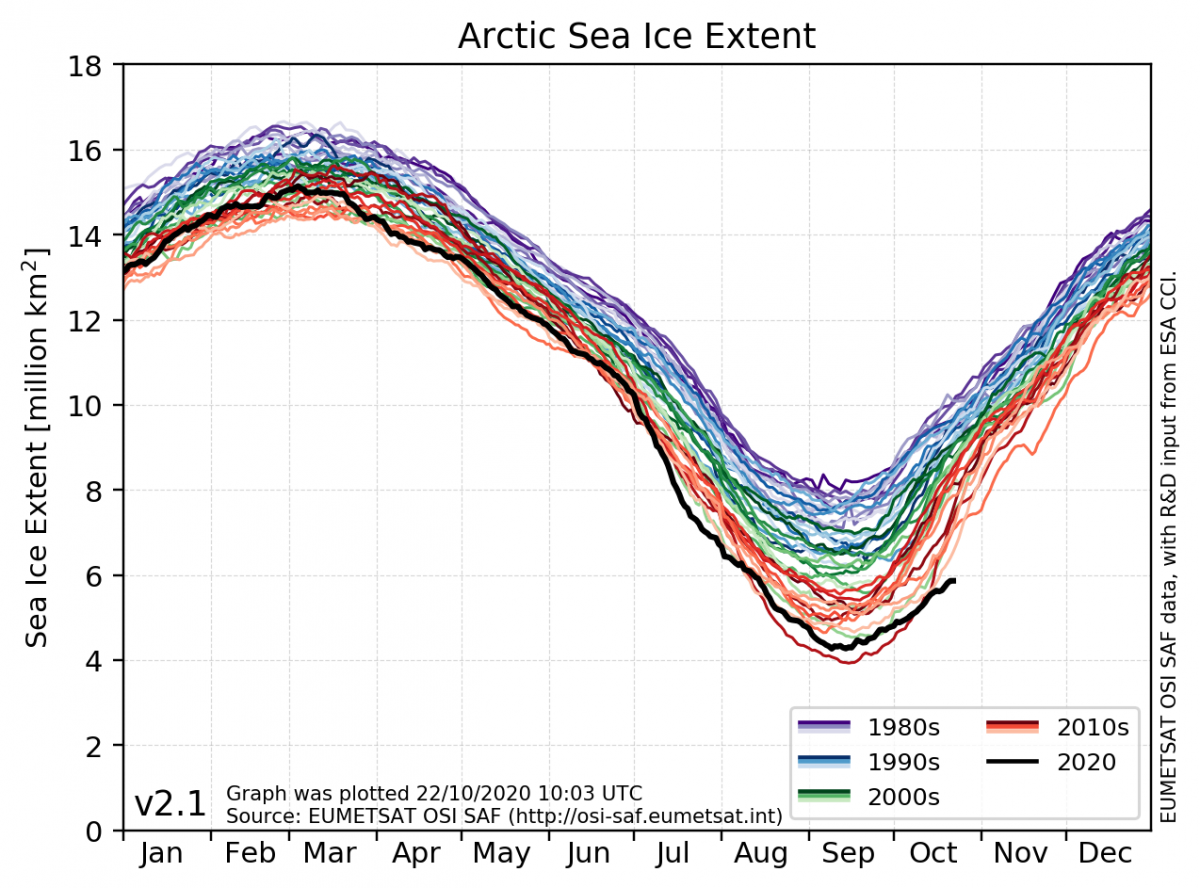 So far, 2020 is one of the years we have measured the least sea ice in the Arctic. In October, almost four million square kilometers of ice are missing compared to what was common in the 80s. This corresponds to an area ten times the size of Norway.
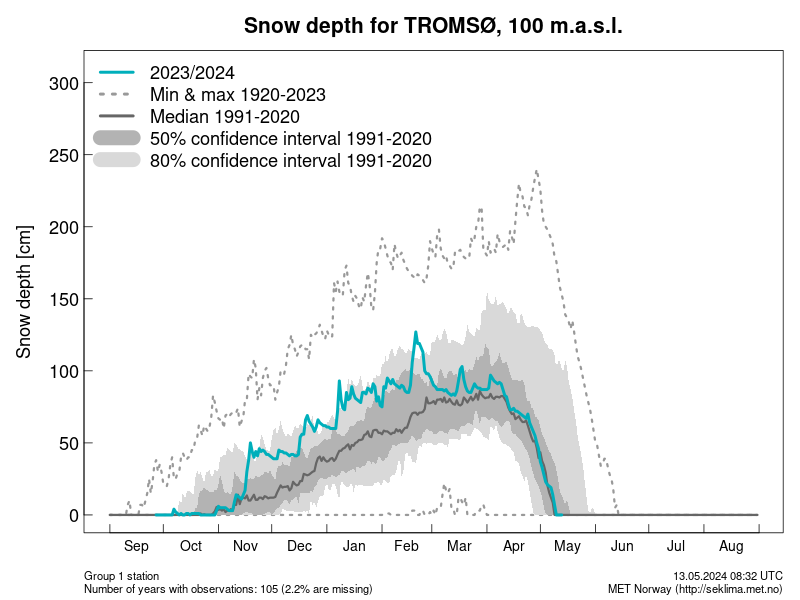 Snow depth is observed daily, both manually and automatically, at stations throughout Norway. At cryo.met.no we have now further developed a product that shows the current snow depth (starting 1st september every year) in relation to previous years and all-time highs and lows.
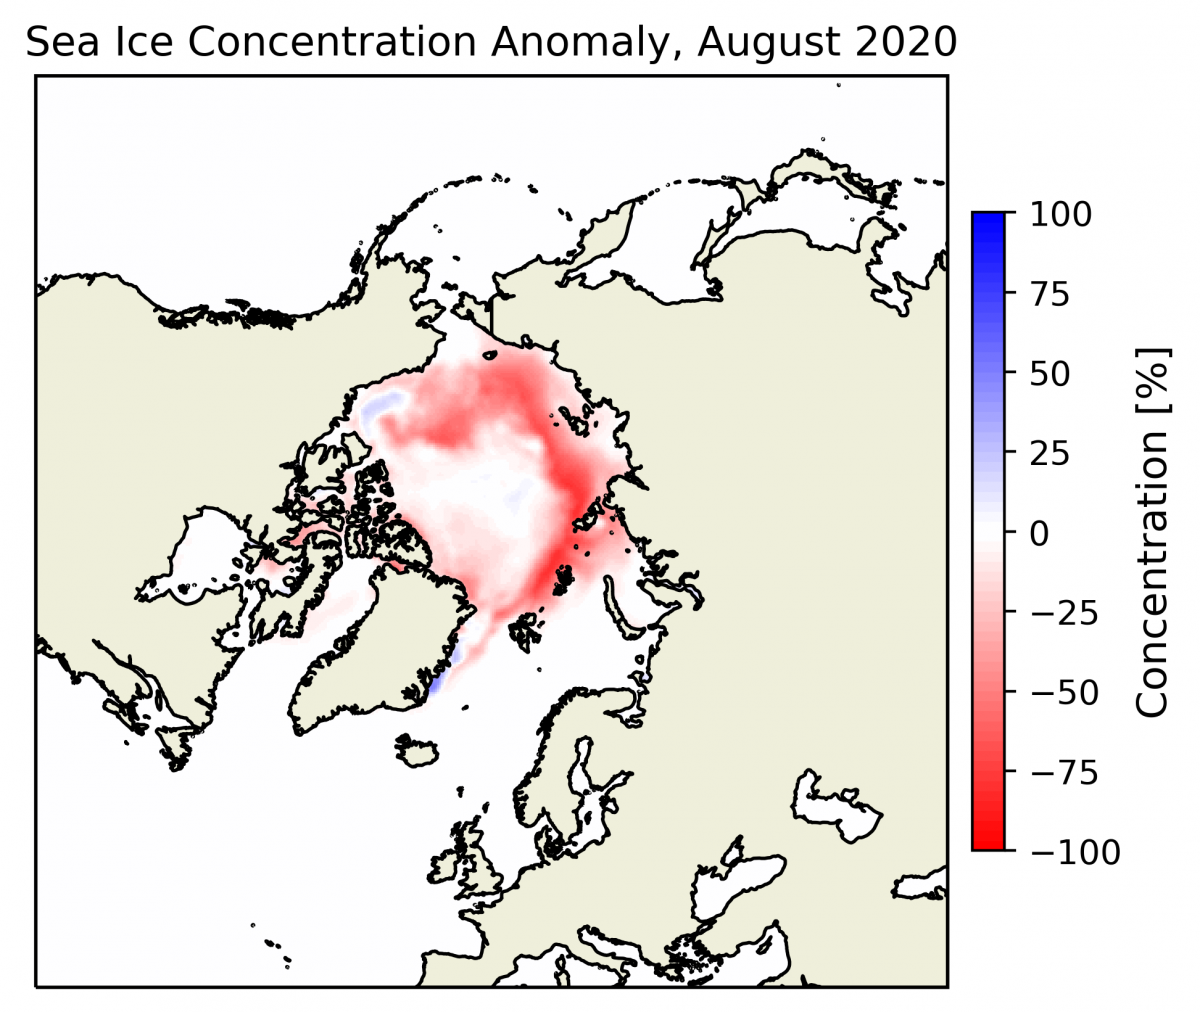 The summer of 2020 broke several records in the Arctic. Here's an updated status of the Arctic sea-ice conditions in summer 2020.
 The July 2020 mean sea-ice extent is the lowest on record for this month in the 40+ years long satellite record, with an averaged value of 8.1 million square kilometers. July 2020 stole the record from July 2012. The 10 years of lowest sea-ice extent for July have all occurred since 2007.
 Following a very snowy winter, with record snow depths in several places, more than half of Troms and Finnmark has melted free of snow in just a couple of weeks.
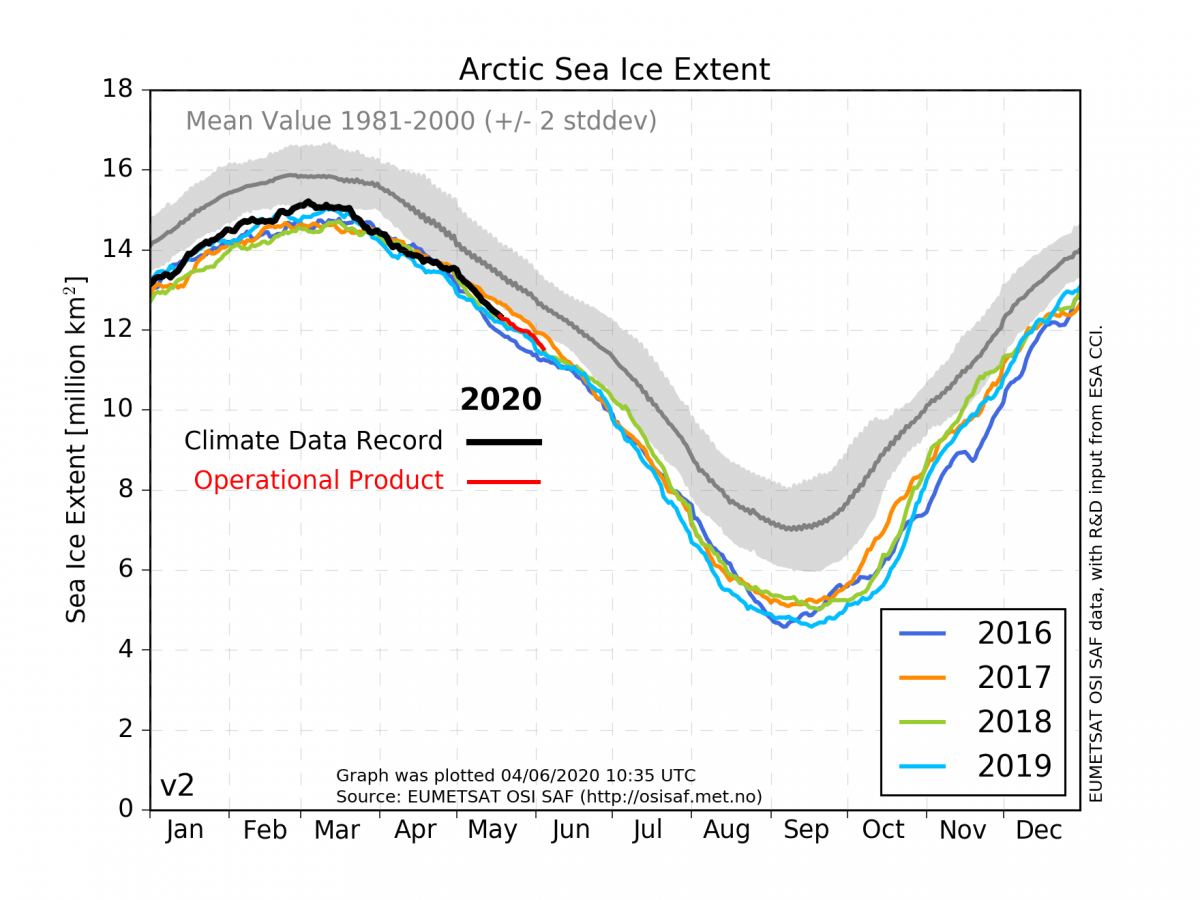 Summer is approaching in the Arctic, and the Arctic sea-ice is melting. From a maximum sea-ice extent in March, which this year occurred on March 3rd, with the ice covering 15.2 million km2, the ice-covered area will more than halved by September.
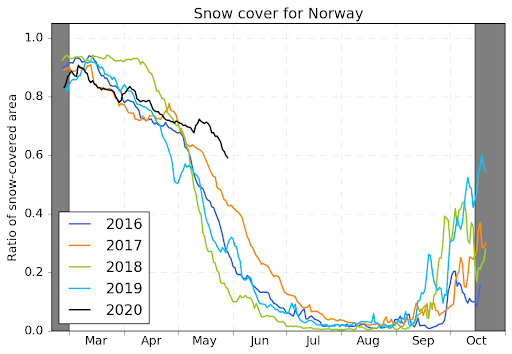 In late May, 60% of the Norwegian mainland is still covered by snow. This is much more than what has been the case for 2016 - 2019. At this time last year 30% of Norway was snow-covered, while the warm spring two years ago led to a total snow cover of 10% at the end of May 2018.
We have a PhD position on Remote Sensing of Sea Ice!
Closing date 7th June 2020!
![]() Following in the footsteps of Nansen and his Fram expedition more than one hundred years ago, the research vessel Polarstern has been frozen into the ice since October, and drifts in the Arctic Ocean towards Svalbard and the Fram Strait. This international expedition is called MOSAiC (https://mosaic-expedition.org/). In 1893-1896 it took Nansen’s ship nearly three years to drift across the Arctic Ocean. For MOSAiC the journey has been less than a year.
Following in the footsteps of Nansen and his Fram expedition more than one hundred years ago, the research vessel Polarstern has been frozen into the ice since October, and drifts in the Arctic Ocean towards Svalbard and the Fram Strait. This international expedition is called MOSAiC (https://mosaic-expedition.org/). In 1893-1896 it took Nansen’s ship nearly three years to drift across the Arctic Ocean. For MOSAiC the journey has been less than a year.
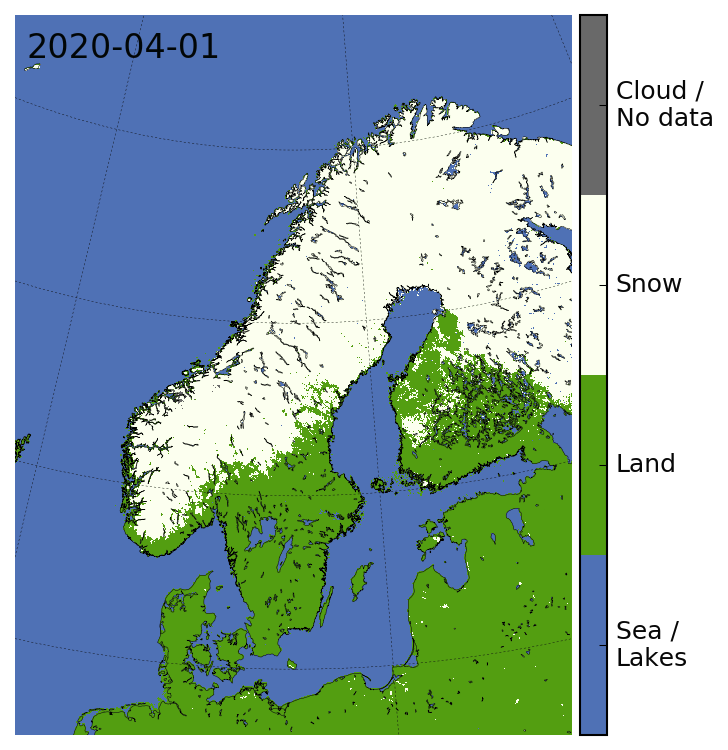 While parts of southern Norway are welcoming a greener spring, many places in Norway are still covered in large amounts of snow.
 The yearly maximum (in the Arctic) and minimum (in the Antarctic) sea-ice extent occurs in February/March. With satellite data processed at Norwegian Meteorological Institute the sea-ice extent is tracked and described on a daily basis.
 Børge Ousland and Mike Horn’s 87 day expedition to cross the Arctic Ocean via the North Pole on skis, from boat to boat without assistance, took place during changing sea ice conditions. Using sea ice drift products - retrieved daily from satellite data - we can estimate the influence ice drift had on the expedition.
 The Norwegian Meteorological Institute is hosting a break-out session at the Arctic Frontiers 2020 meeting in Tromsø.
 The snow cover maps are made from satellite measurements of reflected sunlight. Due to low hanging sun and polar night these data are not available during parts of the winter. The snow cover maps will reappear on cryo.met.no from early February 2020.
 The "hot spot" is the MOSAiC expedition as seen by the NOAA-20 satellite (VIIRS DNB image).
![]() Met Norway has now taken over running the Ice Watch observing system, check out the new website!
Met Norway has now taken over running the Ice Watch observing system, check out the new website!
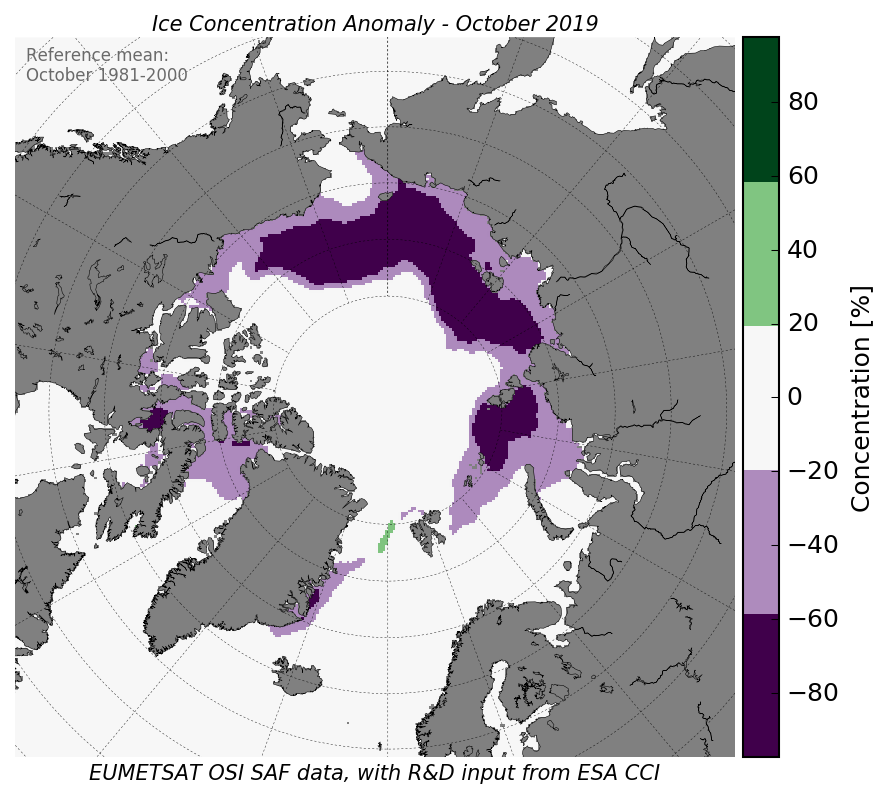 October 2019 sets a new record low for October mean sea-ice extent in the Arctic and the strongest reduction in sea-ice cover is happening north of Siberia and Alaska.
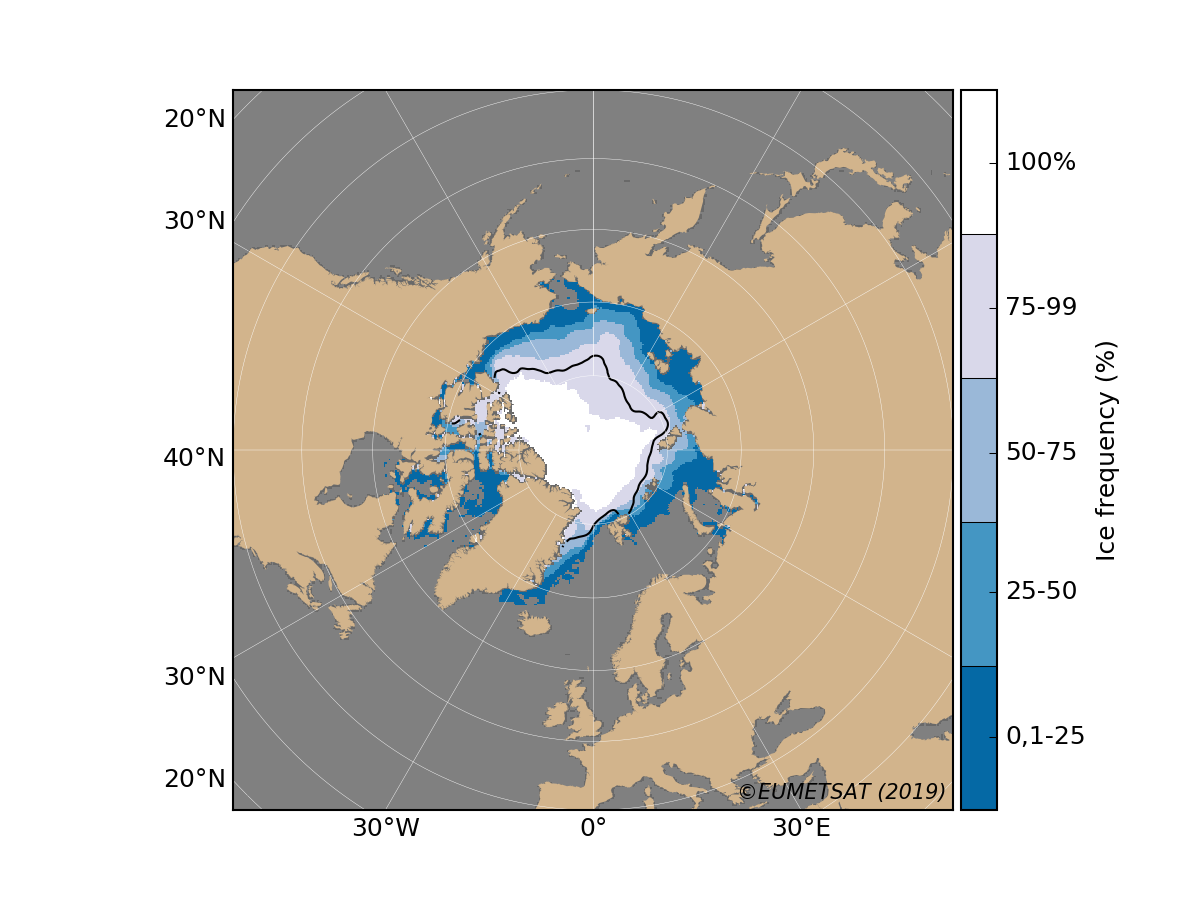 September is typically the month with least sea ice in the Arctic, and with most sea ice in the Antarctic. How did the sea ice behave this summer? We take a look back.
 August 2019 was the second-lowest sea-ice extent of all august months since 1979 over the Arctic.
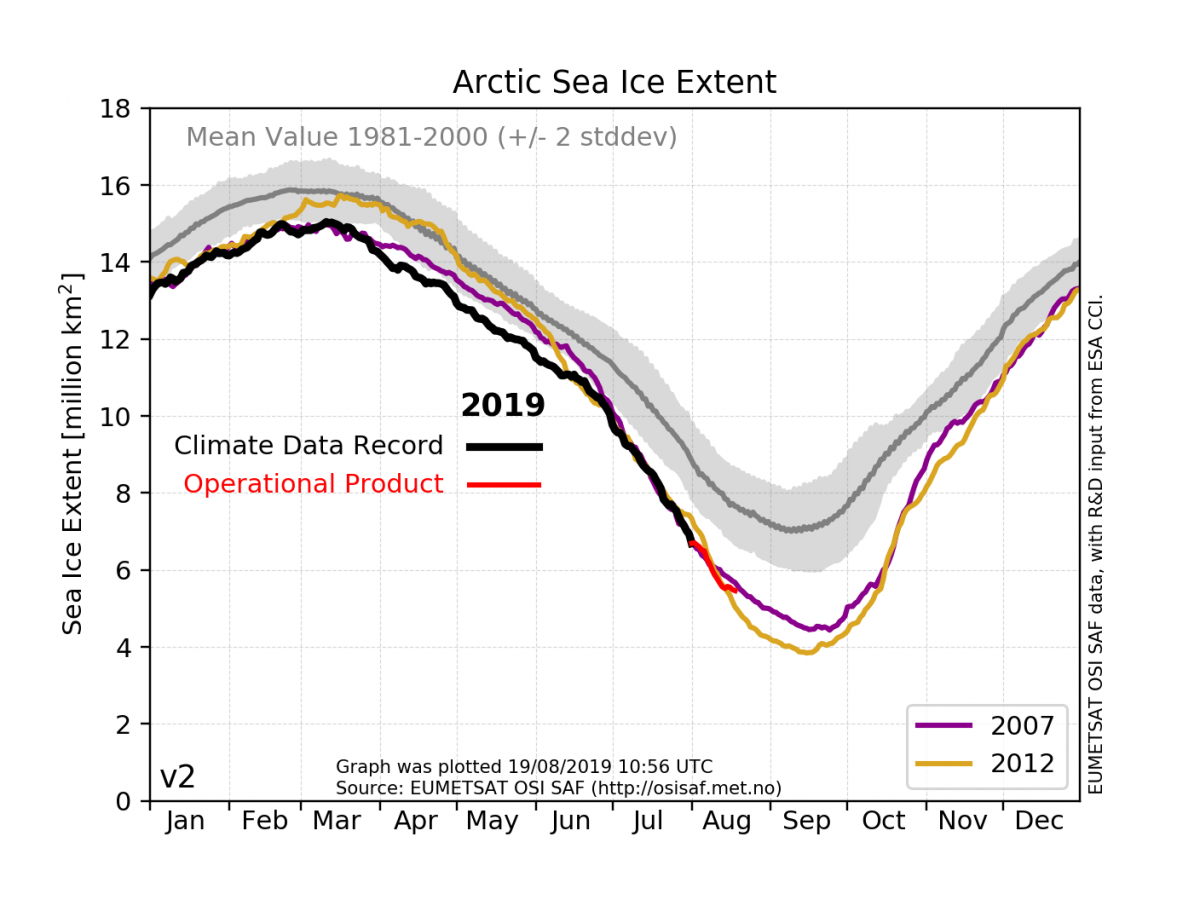 This webpage will hold daily updated sea-ice extent graphs until the end of the Arctic melt season 2019.
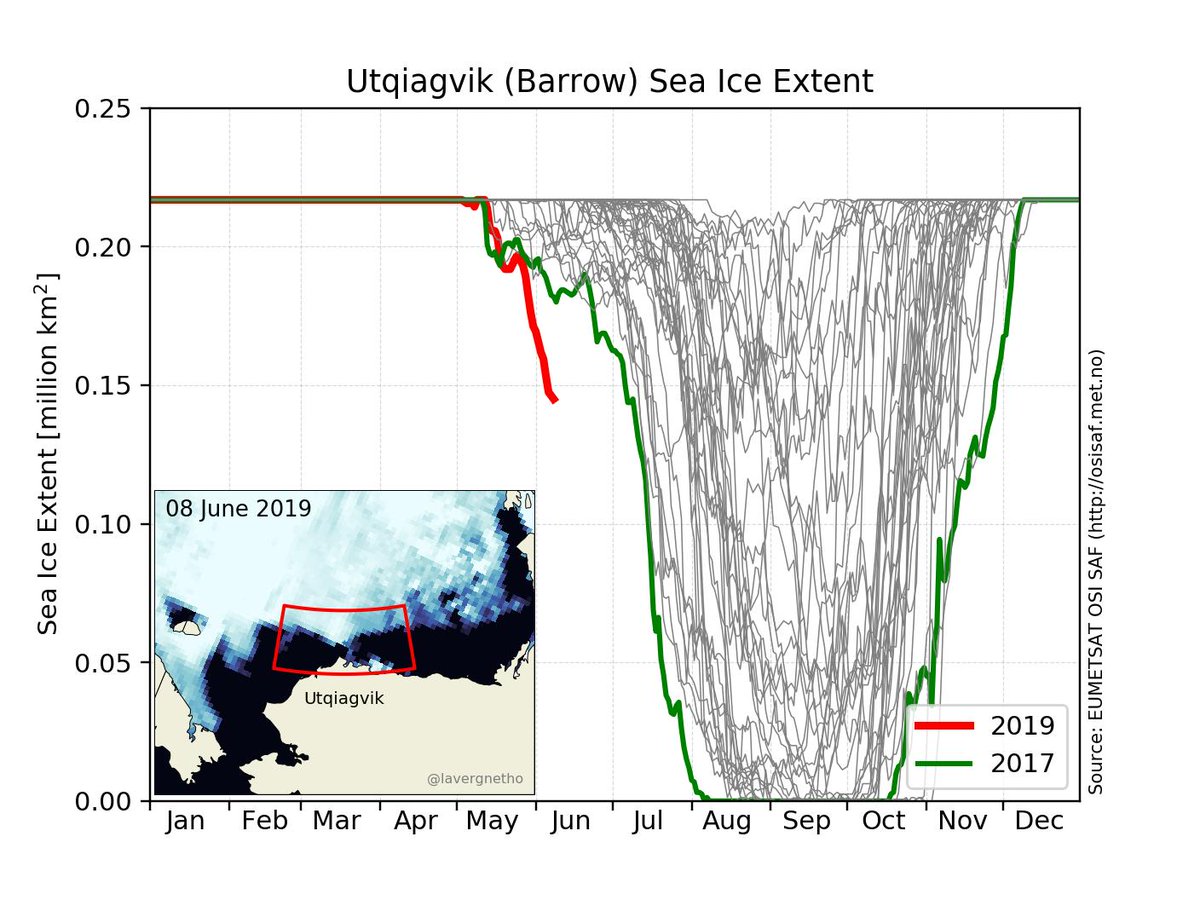 The 2019 sea ice melt outside the Alaskan city Utqiagvik (Barrow) happens record early. The regional sea ice extent of June 2019 is comparable to the July extent for the previous record year of 2017. The 2019 regional sea ice extent curve is two months earlier than for the 1980s.
 This animation shows the snow cover melting away through Easter 2019. Each daily snow cover map is based on satellite data information from the AVHRR instrument flying on polar orbiting satellites.
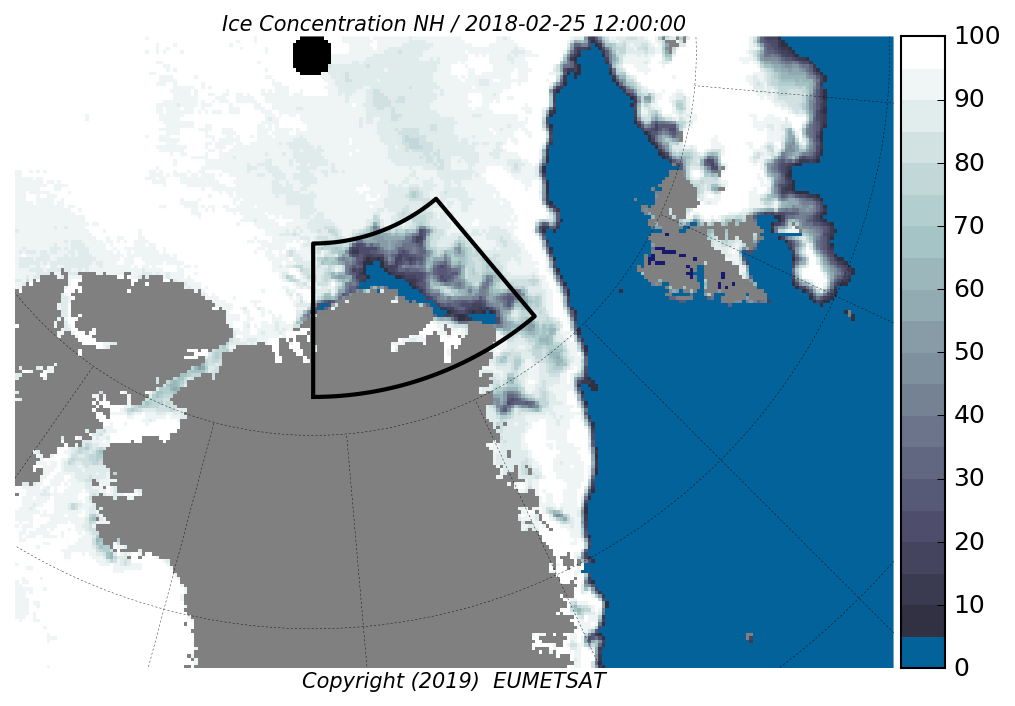 2018 was the first time since the start of satellite observations in 1979 that an area of open water (or polynya) in the sea ice occurred north of Greenland during winter months.
![]()