
The yearly maximum Arctic sea-ice extent occurs in February/March, which is also the timing for the yearly minimum Antarctic sea-ice extent. The Norwegian Meteorological Institute uses satellite data to track and describe sea-ice extent on a daily basis.
Sea-ice maximum in the Arctic
This year’s Arctic maximum sea-ice extent occurred on March 9 with a coverage of 14.97 million km2 (*). Figure 1 shows the daily sea-ice extent over the whole year. As can be seen in the figure, the winter maximum on March 10 was followed a week after by a secondary peak of 14.95 million km2, whereafter the ice extent is declining. This double-peak behavior was already forecasted by numerical models (see Figure 3).
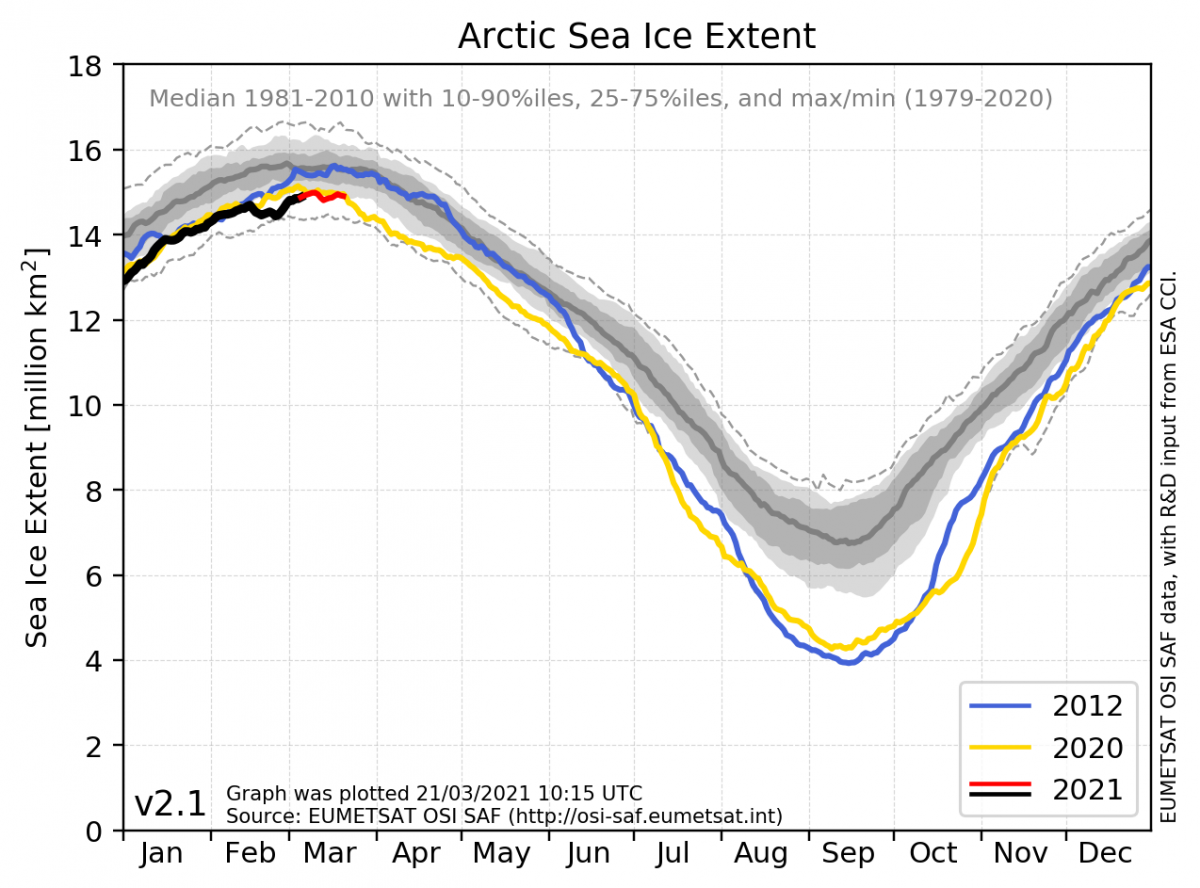
The 2021 Arctic maximum is higher than the five recent maxima of 2015-2019, which again are all among the 8th lowest ice maxima ever recorded (see table below). However, 2021 is at present well below the 30-year climatology of about 15.5 million km2 for this time of year. Note, that the maximum in 2020 was slightly higher than 2021 with 15.14 million km2 (read more in last year's maximum-story here). The table below shows the top 5 highest and 5 lowest maxima of sea-ice extent recorded in the Arctic - and at what day they occurred:
|
Top 5 highest Arctic maxima |
Top 5 lowest Arctic maxima |
|---|---|
|
1979-02-27 16.66 million km2 1982-02-25 16.55 million km2 1983-03-12 16.50 million km2 1988-03-08 16.45 million km2 1980-03-07 16.42 million km2 |
2017-02-23 14.60 million km2 2018-03-16 14.62 million km2 2016-03-22 14.69 million km2 2015-02-25 14.70 million km2 2006-03-09 14.83 million km2 |
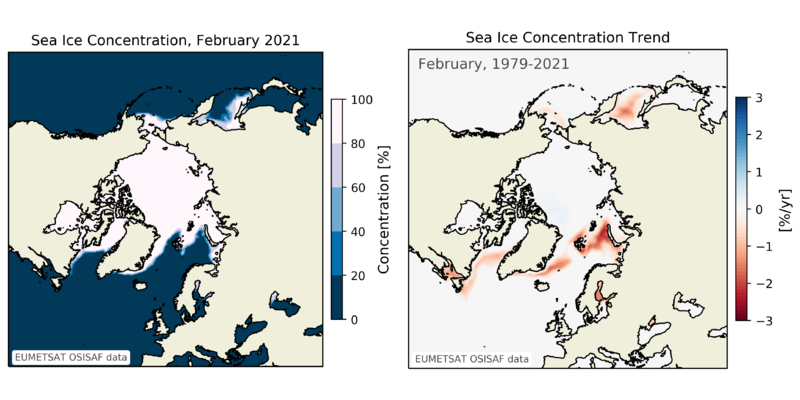
The negative trend of the sea ice in the Northern Hemisphere is very significant. The maps below show the sea-ice condition for February. The left map shows the sea-ice concentration of this year and the right map shows the trend in sea-ice concentration (in February) over the full satellite record from 1979 to 2021. Despite interannual variability of the sea ice, the trend is clearly negative along the entire ice edge, meaning loss of sea ice and an ice edge located further north than earlier in the record.
Can the winter sea-ice extent predict the following summer sea-ice conditions?
Finally, it is also interesting to note that this year’s maximum (Figure 1) is lower than both 2012 and 2020 - the two years that ended up having remarkably low sea-ice extent during summer. However, the sea-ice is a dynamic floating medium, largely affected by temperature, wind, and ocean currents, and therefore it is not possible at this stage to predict the development of the sea ice from this maximum to the minimum in late summer.
On a much shorter timescale, we may use numerical models to forecast the sea-ice behavior over the next few days. The animation below is an example of such a forecast made on March 17. The daily sea ice map of the Arctic (including ice drift arrows) is from the numerical global model, CMEMS GLO, running from March 8 (2 days before the recent maximum) to March 22. In the upper left subplot is given the corresponding sea-ice extent - both observations until March 16 from satellite OSI SAF products (black) and estimates based on two independent numerical models, ECMWF IFS (orange) and CMEMS GLO (blue), continuing almost a week into the future.
Sea-ice minimum in the Antarctic
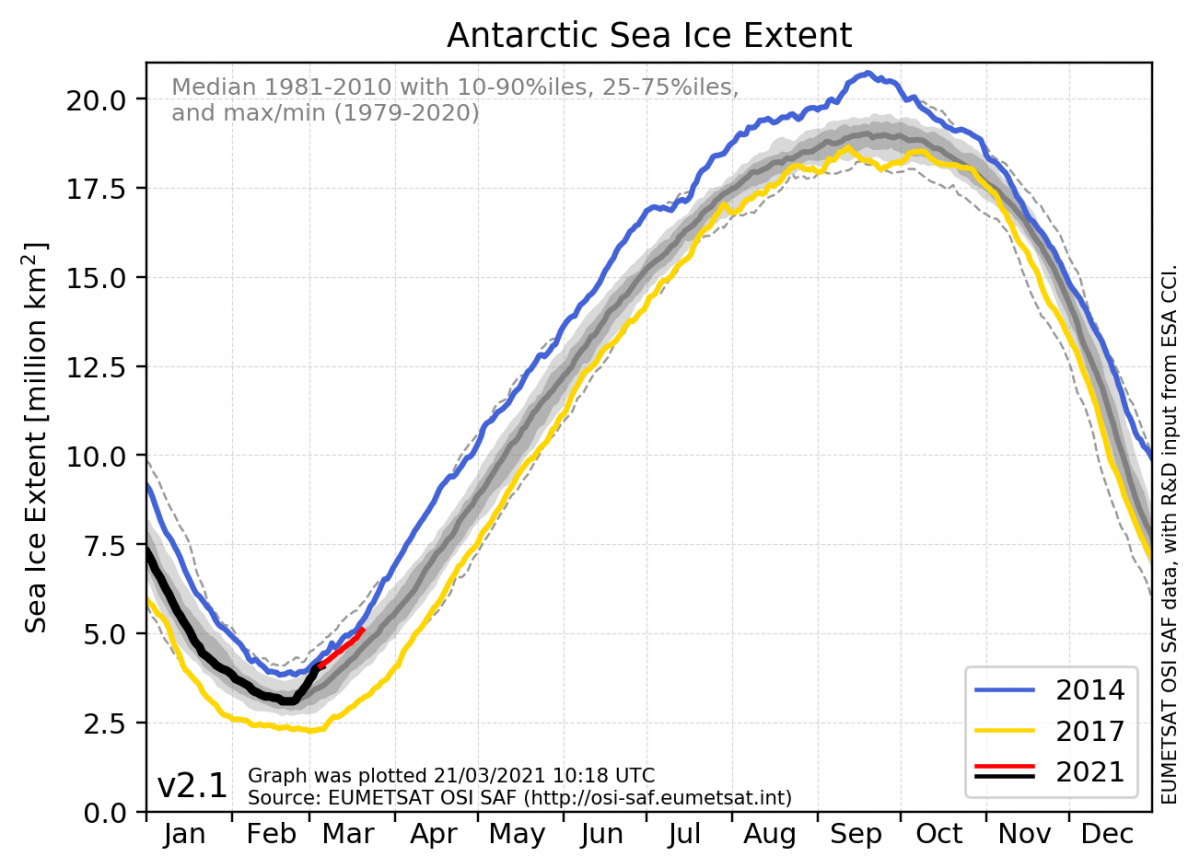
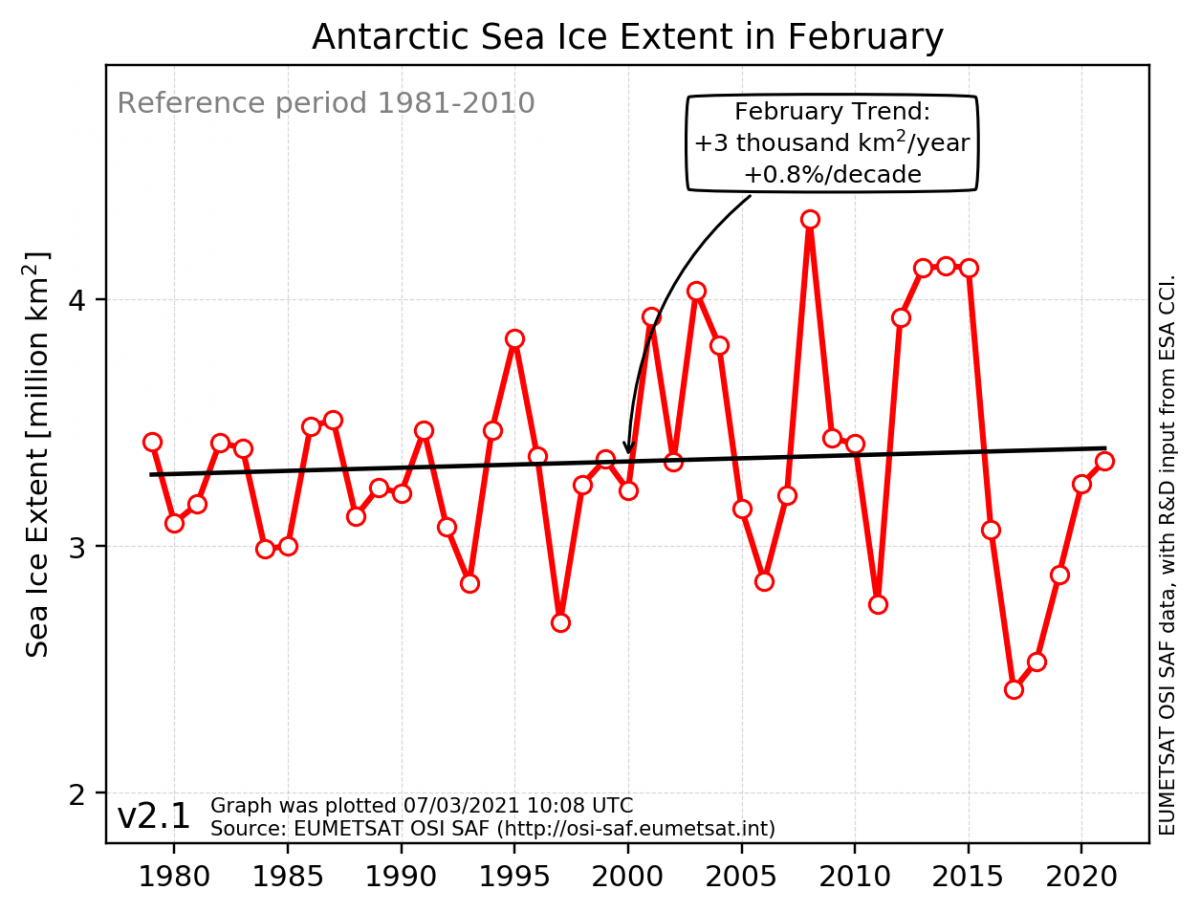
The 2021 Antarctic minimum sea-ice extent occurred on February 23 with around 3.09 million km2 of ice cover. As seen in Figure 3 this year’s sea-ice extent follows the 30-year climatology of 1981-2010 very closely, however with a very rapid increase in re-freezing since the minimum.
The table below shows the top 5 lowest and 5 highest minima of sea-ice extent recorded in the Antarctic, and at what day they occurred:
|
Top 5 lowest Antarctic minima |
Top 5 highest Antarctic minima |
|---|---|
|
2017-03-01 2.24 million km2 2018-02-19 2.33 million km2 1997-02-26 2.48 million km2 2011-02-21 2.52 million km2 1993-02-17 2.63 million km2 |
2008-02-19 4.09 million km2 2013-02-19 3.91 million km2 2015-02-22 3.87 million km2 2003-02-19 3.84 million km2 2014-02-18 3.83 million km2 |
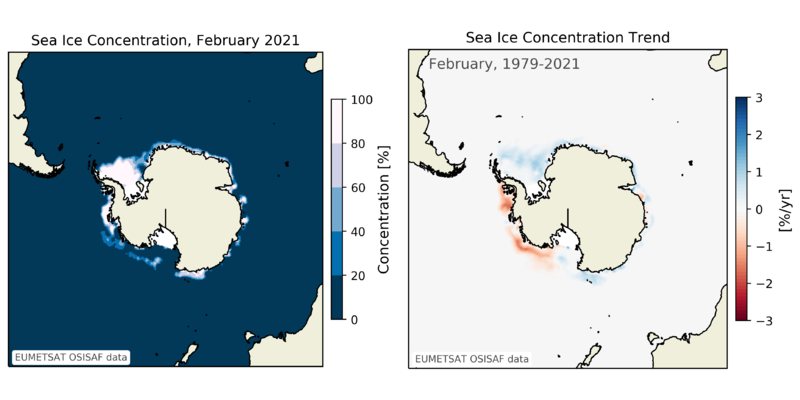
It is more difficult to conclude on significant changes in the Southern Hemisphere sea-ice conditions. There is not the same clear negative or positive trend during the satellite record, but we see a trend towards larger annual variabilities, see e.g. the February time series below with larger oscillations in more recent years.
However, looking at the sea-ice trends over the full record, 1979-2021, we see some negative trends in the regions of the Bellinghausen and Amundsen Seas, and positive trends in e.g. the Weddell and Somov Seas.
What do we mean by the 30-year climate reference period?
When we present the sea-ice condition today, or for this winter or some other time period, we want to be able to discuss how the ice behaves relative to some “normal” conditions: Is the ice distribution different than expected, and in what ways?
But in a changing climate, there exists no “normal”.
We therefore often relate current observations to the average conditions over a longer time period. It has become common practice to use a 30-year climatology as a base reference, also called the “climate normal”. The World Meteorological Organization describes the purposes of climate normals as (WMO, 2017):
- They serve as a benchmark against which recent or current observations can be compared, including providing a basis for many anomaly-based climate datasets (for example, global mean temperatures).
- They are also widely used, implicitly or explicitly, as a prediction of the conditions most likely to be experienced in a given location.”
It may be argued which 30-year period should be used as a base reference. It is obviously the best if the same 30-year period is used across different data providers. For many years (and still used in some analyses) the 1961-1990 period was the most common period in weather and climate studies. But with a rapidly changing climate, it makes sense to update the climate normal definition more frequently, e.g. every 10 years. So until the end of 2020, many national weather services used the 30-year period of 1981-2010. And since the beginning of 2021 several data providers and services (including MET Norway) have updated their 30-year period to cover 1991-2020 (e.g. Copernicus Climate Change Service, C3S). And others have decided to stick to the 1981-2010 period (e.g. National Snow and Ice Data Center, NSIDC).
For our sea-ice index (OSISAF, v2.1) we are now in a transition phase. In our sea-ice index quicklooks (cryo.met.no) we still provide the figures and relative trend calculations with the 1981-2010 climatology. But we are considering updating to use the 1991-2020 period, and provide both in parallel for a period. A clear advantage of switching to the 1991-2020 climatology is that we hereby avoid including the more uncertain products from the beginning of the satellite record based on the instrument SMMR.
The two climatologies certainly differ in the Arctic, with the more recent period reflecting more the recent conditions of less sea ice. Therefore, the user of the quicklooks and the estimates of relative trends and anomalies should be aware of this difference.
_____________________________
* When this story was first published March 21, the day of maximum sea-ice extent in the Arctic was registered to March 10 with a coverage of 14.97 million km2. This conclusion was based on the near-real-time estimates that are meant to supplement the climate data record within the recent 16 days corresponding to the latency of the climate data record. Now that the climate data record is updated for this period, the maximum sea ice is slightly modified to March 9 with a coverage of 14.97 million km2. Note, that the near-real-time estimates are often visualized with a red extension of the present year's black line in our ice extent plots.