
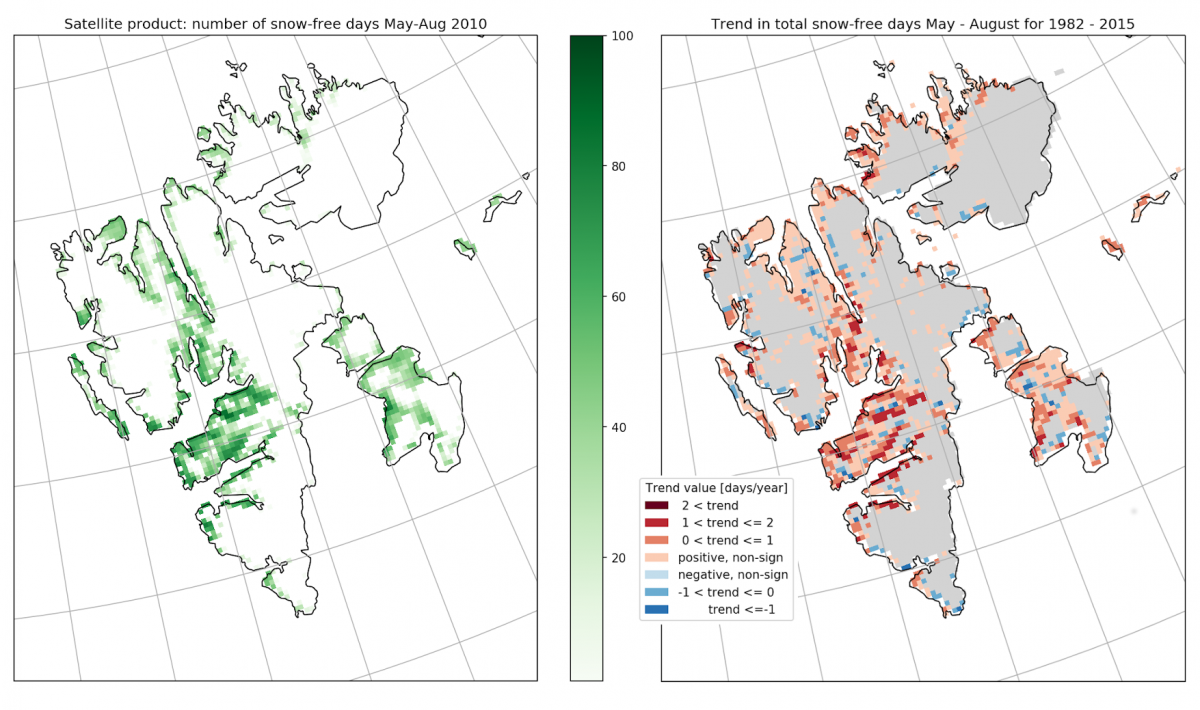
Snow melt on Svalbard typically starts by the end of June. The total area that becomes completely snow-free varies from year to year, but observations support that the snow melt now starts earlier and that a larger total area becomes snow free. A 34 years long time series of daily snow maps for Svalbard, derived from a climate consistent satellite based dataset, has been analyzed to study changes in the terrestrial snow cover over the period 1982 - 2015. In Figure 1 below, the left figure shows the number of snow-free days (in green) during summer 2020. The map to the right shows the changes in the number of snow-free days during summer over the 34 years period. The color shows the size of the changes, where dark red and dark blue correspond to largest changes. The areas of largest positive trends - that is, the largest decrease in the snow season - are concentrated in regions that are dominated by low-land valleys and coastal plains. Most noticeable are the trends centred near the large valleys on Nordenskiöld Land: Adventdalen, Reindalen og Sassendalen. Here, a positive trend in the range 1-2 days per year is found.
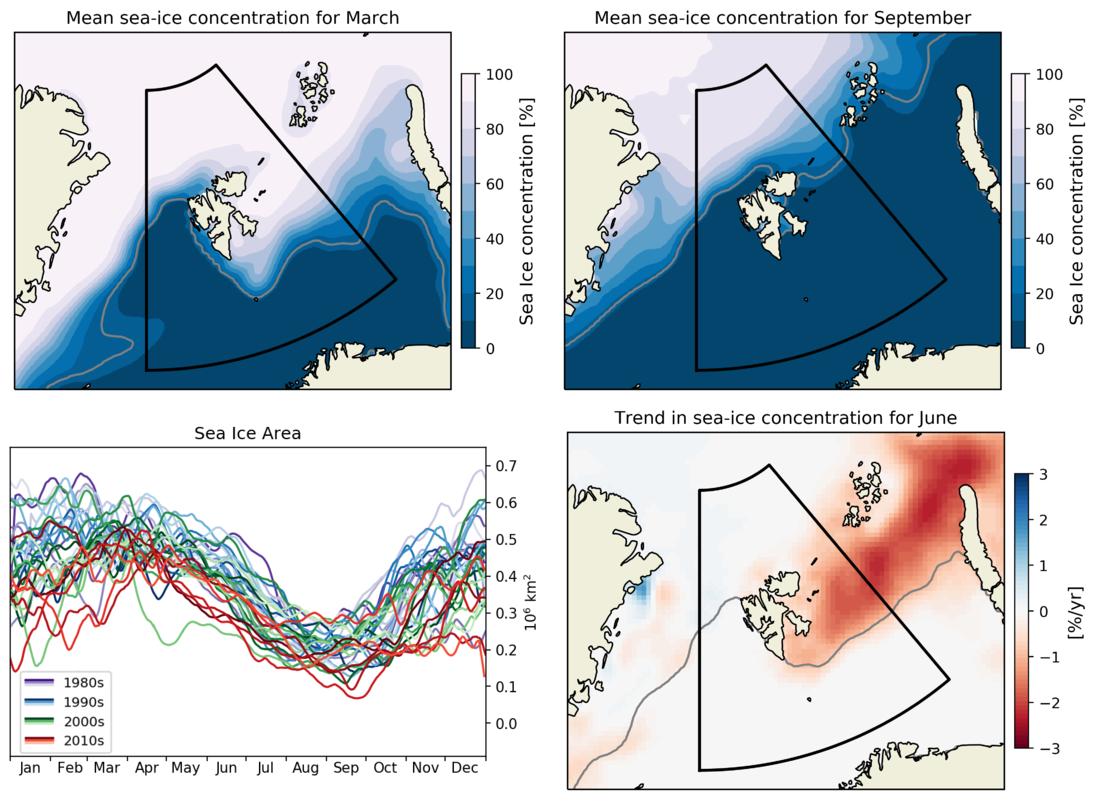
During winter months, Svalbard is almost encapsulated by sea ice except for the western part with much-reduced sea ice due to the influence of the warm Atlantic water in the West Spitsbergen Current. In the summer months, the ice edge retreats northward and is often completely detached from the coast of Svalbard. In order to investigate whether the presence of sea ice influences the onset and speed of snow melting on land, a time series of daily sea-ice area is derived from global sea-ice concentration data within a region around Svalbard. More information on the sea-ice concentration dataset is found here. Typically, the ice cover is the largest around March and the sea-ice minimum occurs around September, see Figure 2 (upper two panels). Figure 2 also shows the seasonal curves of Svalbard sea-ice area for 1982 - 2015 with each year coloured differently (lower left panel). There are large seasonal and interannual variabilities, however, an overall trend of decreasing ice areas per decade is visible throughout the year. The lower right panel shows the spatial distribution of the concentration trends in June. The ice concentrations are seen to be dominated by negative trends (red) in the Svalbard region, especially along the ice edge east of Svalbard into the northern Barents Sea. The negative trends suggest a more retained ice edge and a less dense ice cover around Svalbard which again may result in more direct interaction between the relatively warm open ocean and the winter cold atmosphere.
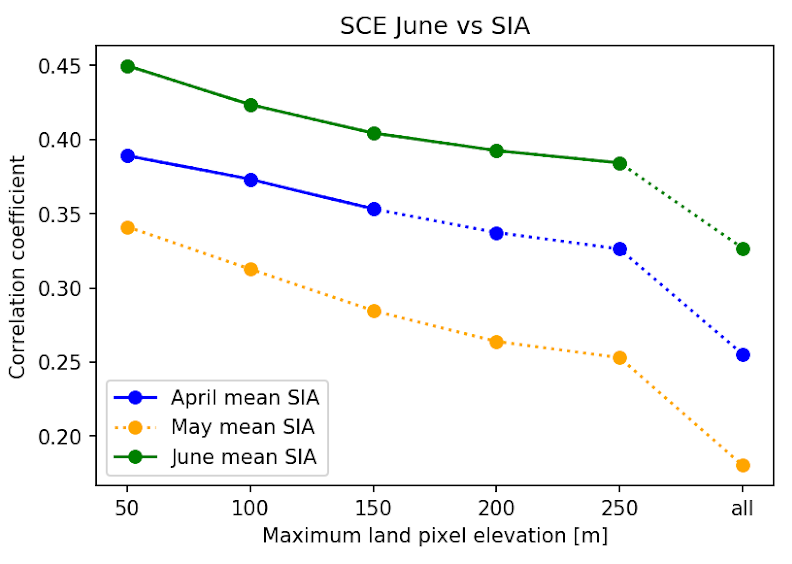
Negative trends dominate both datasets over the 34 years period with less sea-ice cover and shorter snow season. Despite the long-term negative trends in common, how well does the interannual variability relate between the snow cover on land and the amount of ice-covered adjacent seas? The monthly averaged values of sea-ice area and snow cover extent are compared with a range of time lag combinations. Elevation of the land pixel is accounted for, and the strongest correlation is found between the June snow cover and June sea-ice area (green line in Figure 3). The correlation is positive and significant up to 250 meters elevation. The largest value for the correlation coefficient is found when only including snow cover in the lowlands up to 50 meters. June is the month of typical snow melt, and the melting is influenced by the interactions between ocean and atmosphere. An ice-free ocean allows warm air to pass over land to a larger degree than an ice-covered ocean. The air will be cooled with elevation, and might be the reason that no significant correlation is found above 250 meters. It is reasonable to assume that any atmospheric effect from an ice-covered/ice-free ocean also will have a larger influence on the lowlands rather than on the higher mountains where temperatures are colder and often below 0 degrees.
This news story is a summary of a study published in the SIOS SESS report for 2020. The full story can be read here. The work is a collaboration with researchers from the Norwegian Polar Institute, Uppsala University and the Institute of Geophysics at the Polish Academy of Sciences, and is supported financially by SIOS.
Reference
Killie MA, Aaboe S, Isaksen K, Van Pelt W, Pedersen ÅØ, Luks B (2021) Svalbard snow and sea-ice cover: comparing satellite data, on-site measurements, and modelling results. https://doi.org/10.5281/zenodo.4293804
Fact Box
SIOS – Svalbard Integrated Arctic Earth Observing System: an international, interdisciplinary research infrastructure facility in and around Svalbard. SIOS addresses Earth System Science questions related to Global Change. https://sios-svalbard.org/
SIOS State of Environmental Science in Svalbard (SESS) report: an annual report that summarises existing knowledge and data, activities and collaborations, and gives recommendations for the future in Svalbard research. https://sios-svalbard.org/SESSreport
Related news stories on Svalbard's cryosphere: