Ice Service charts

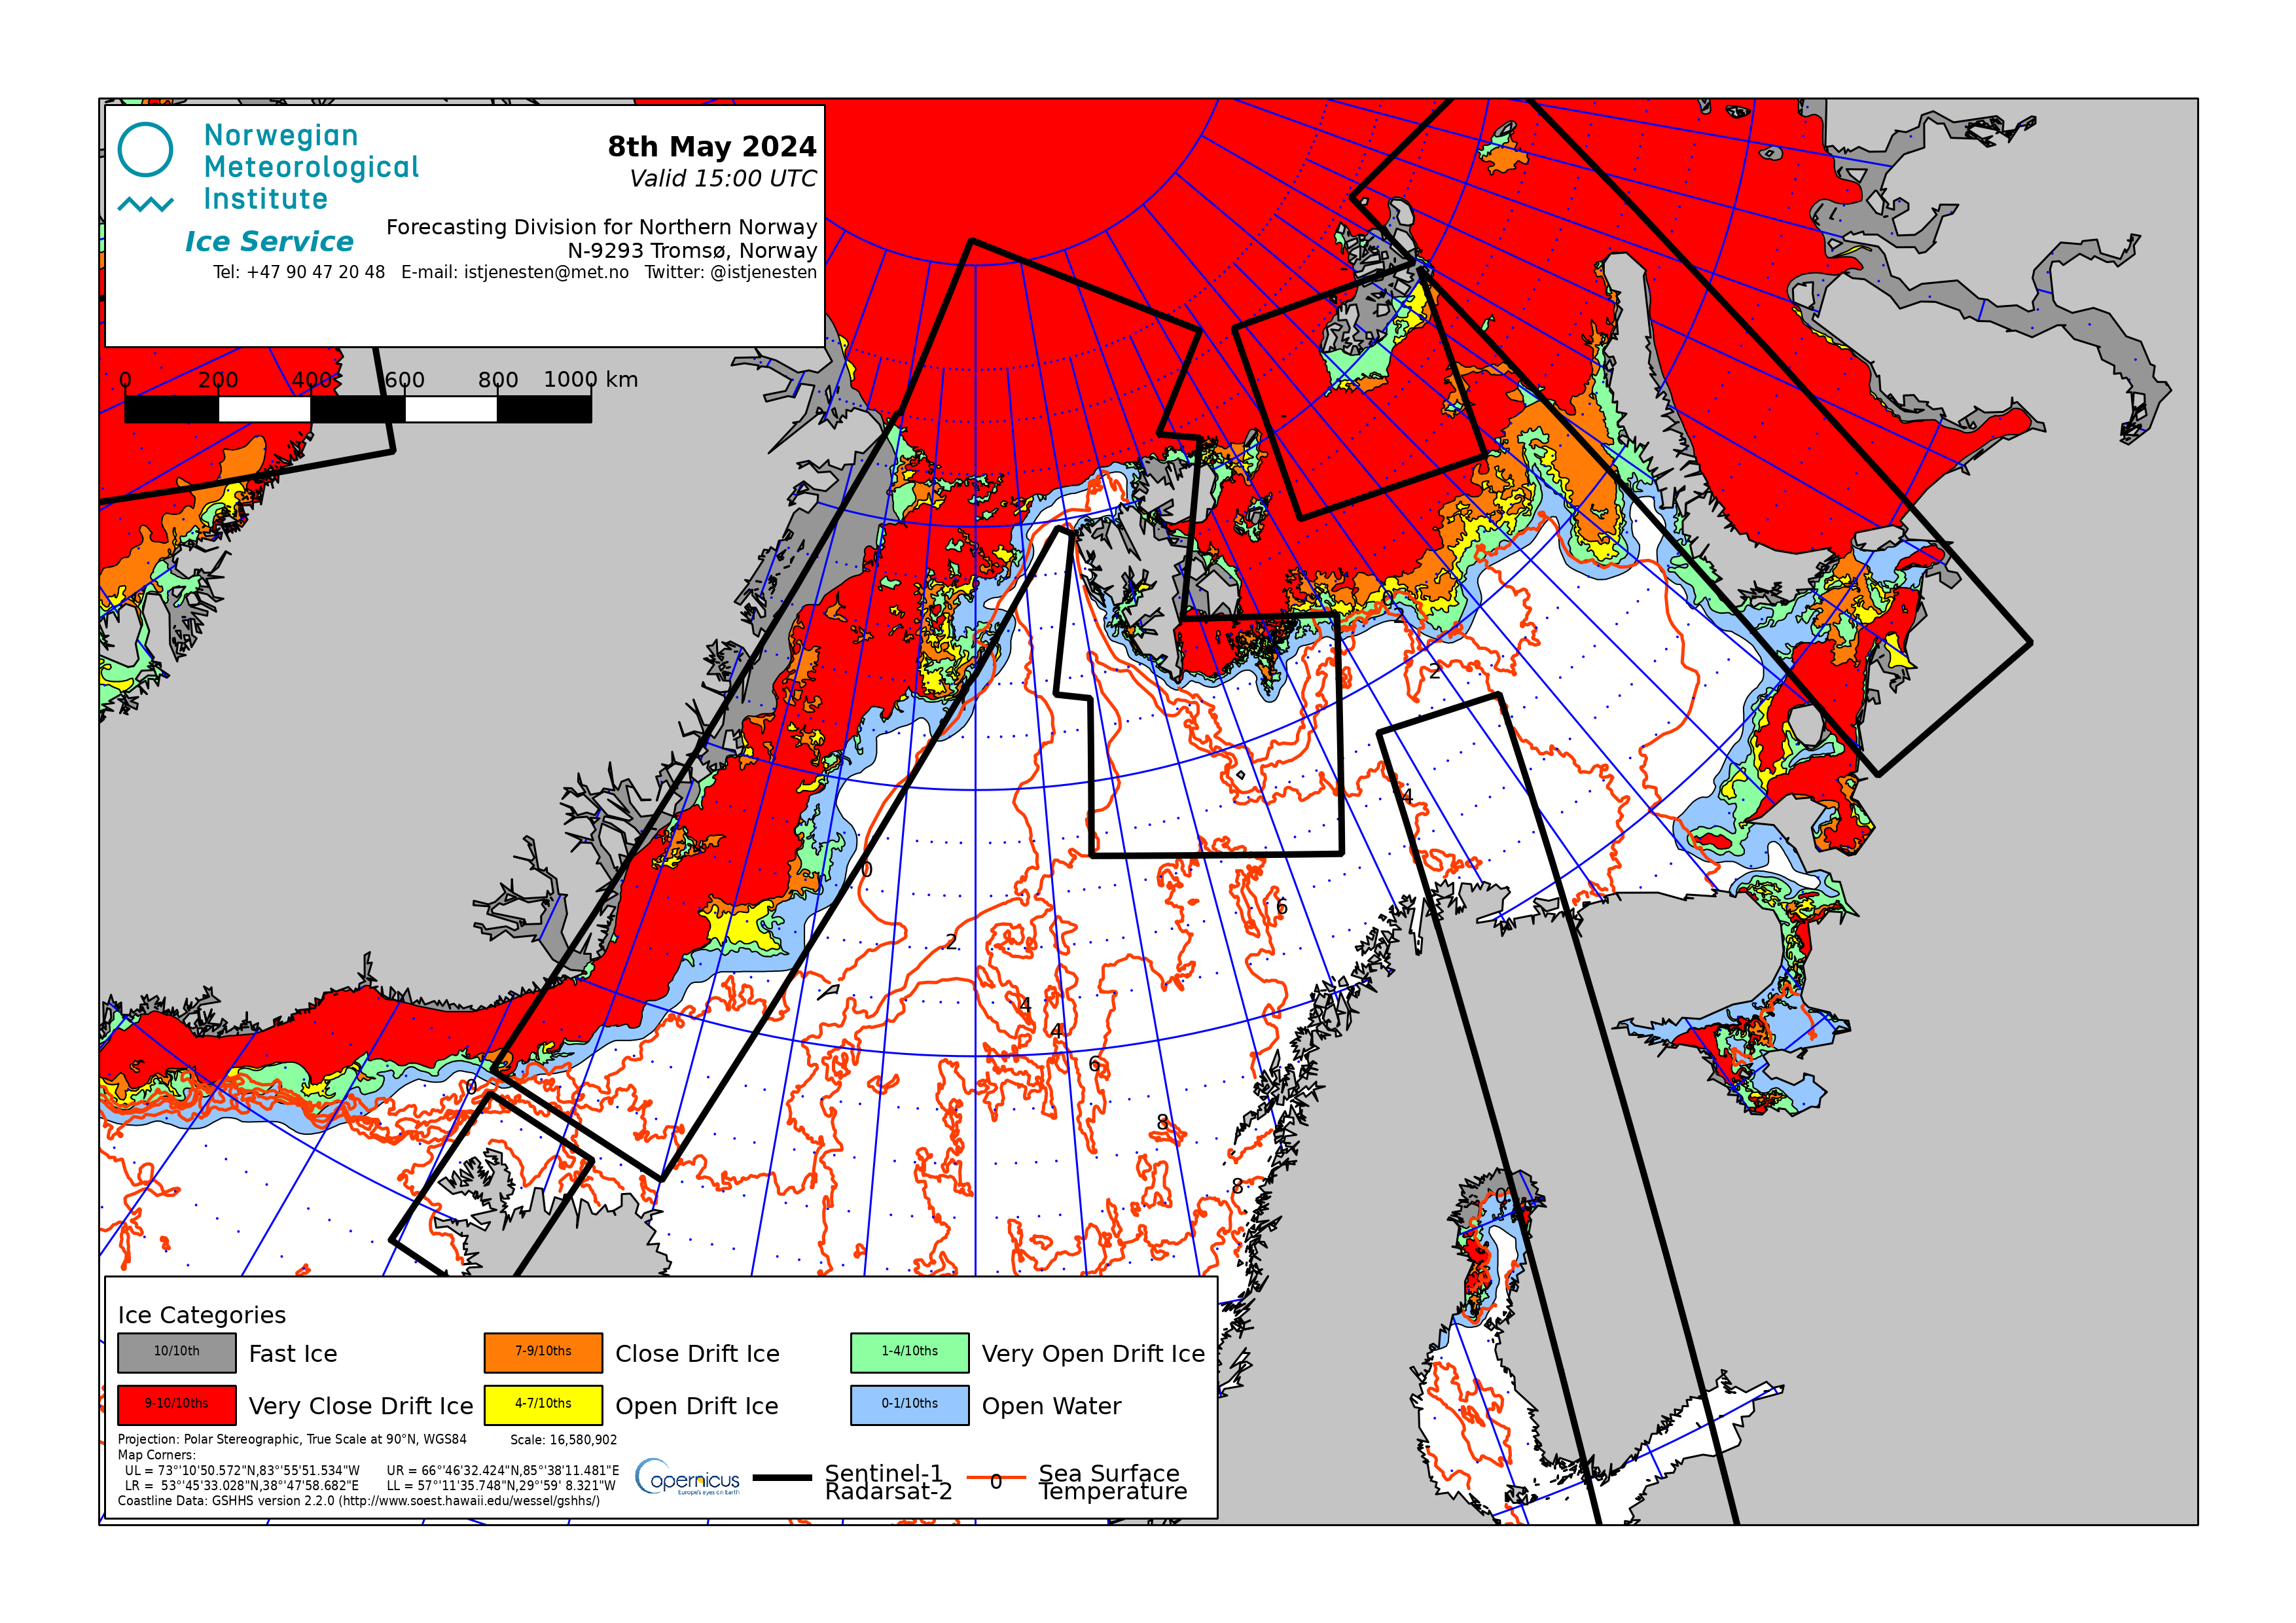
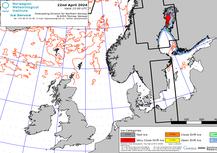
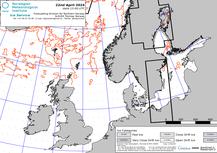
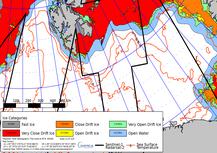
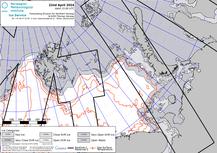
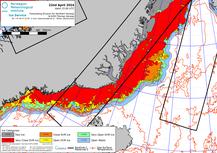
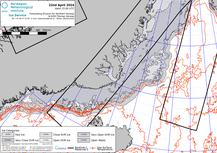
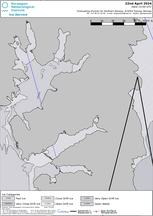
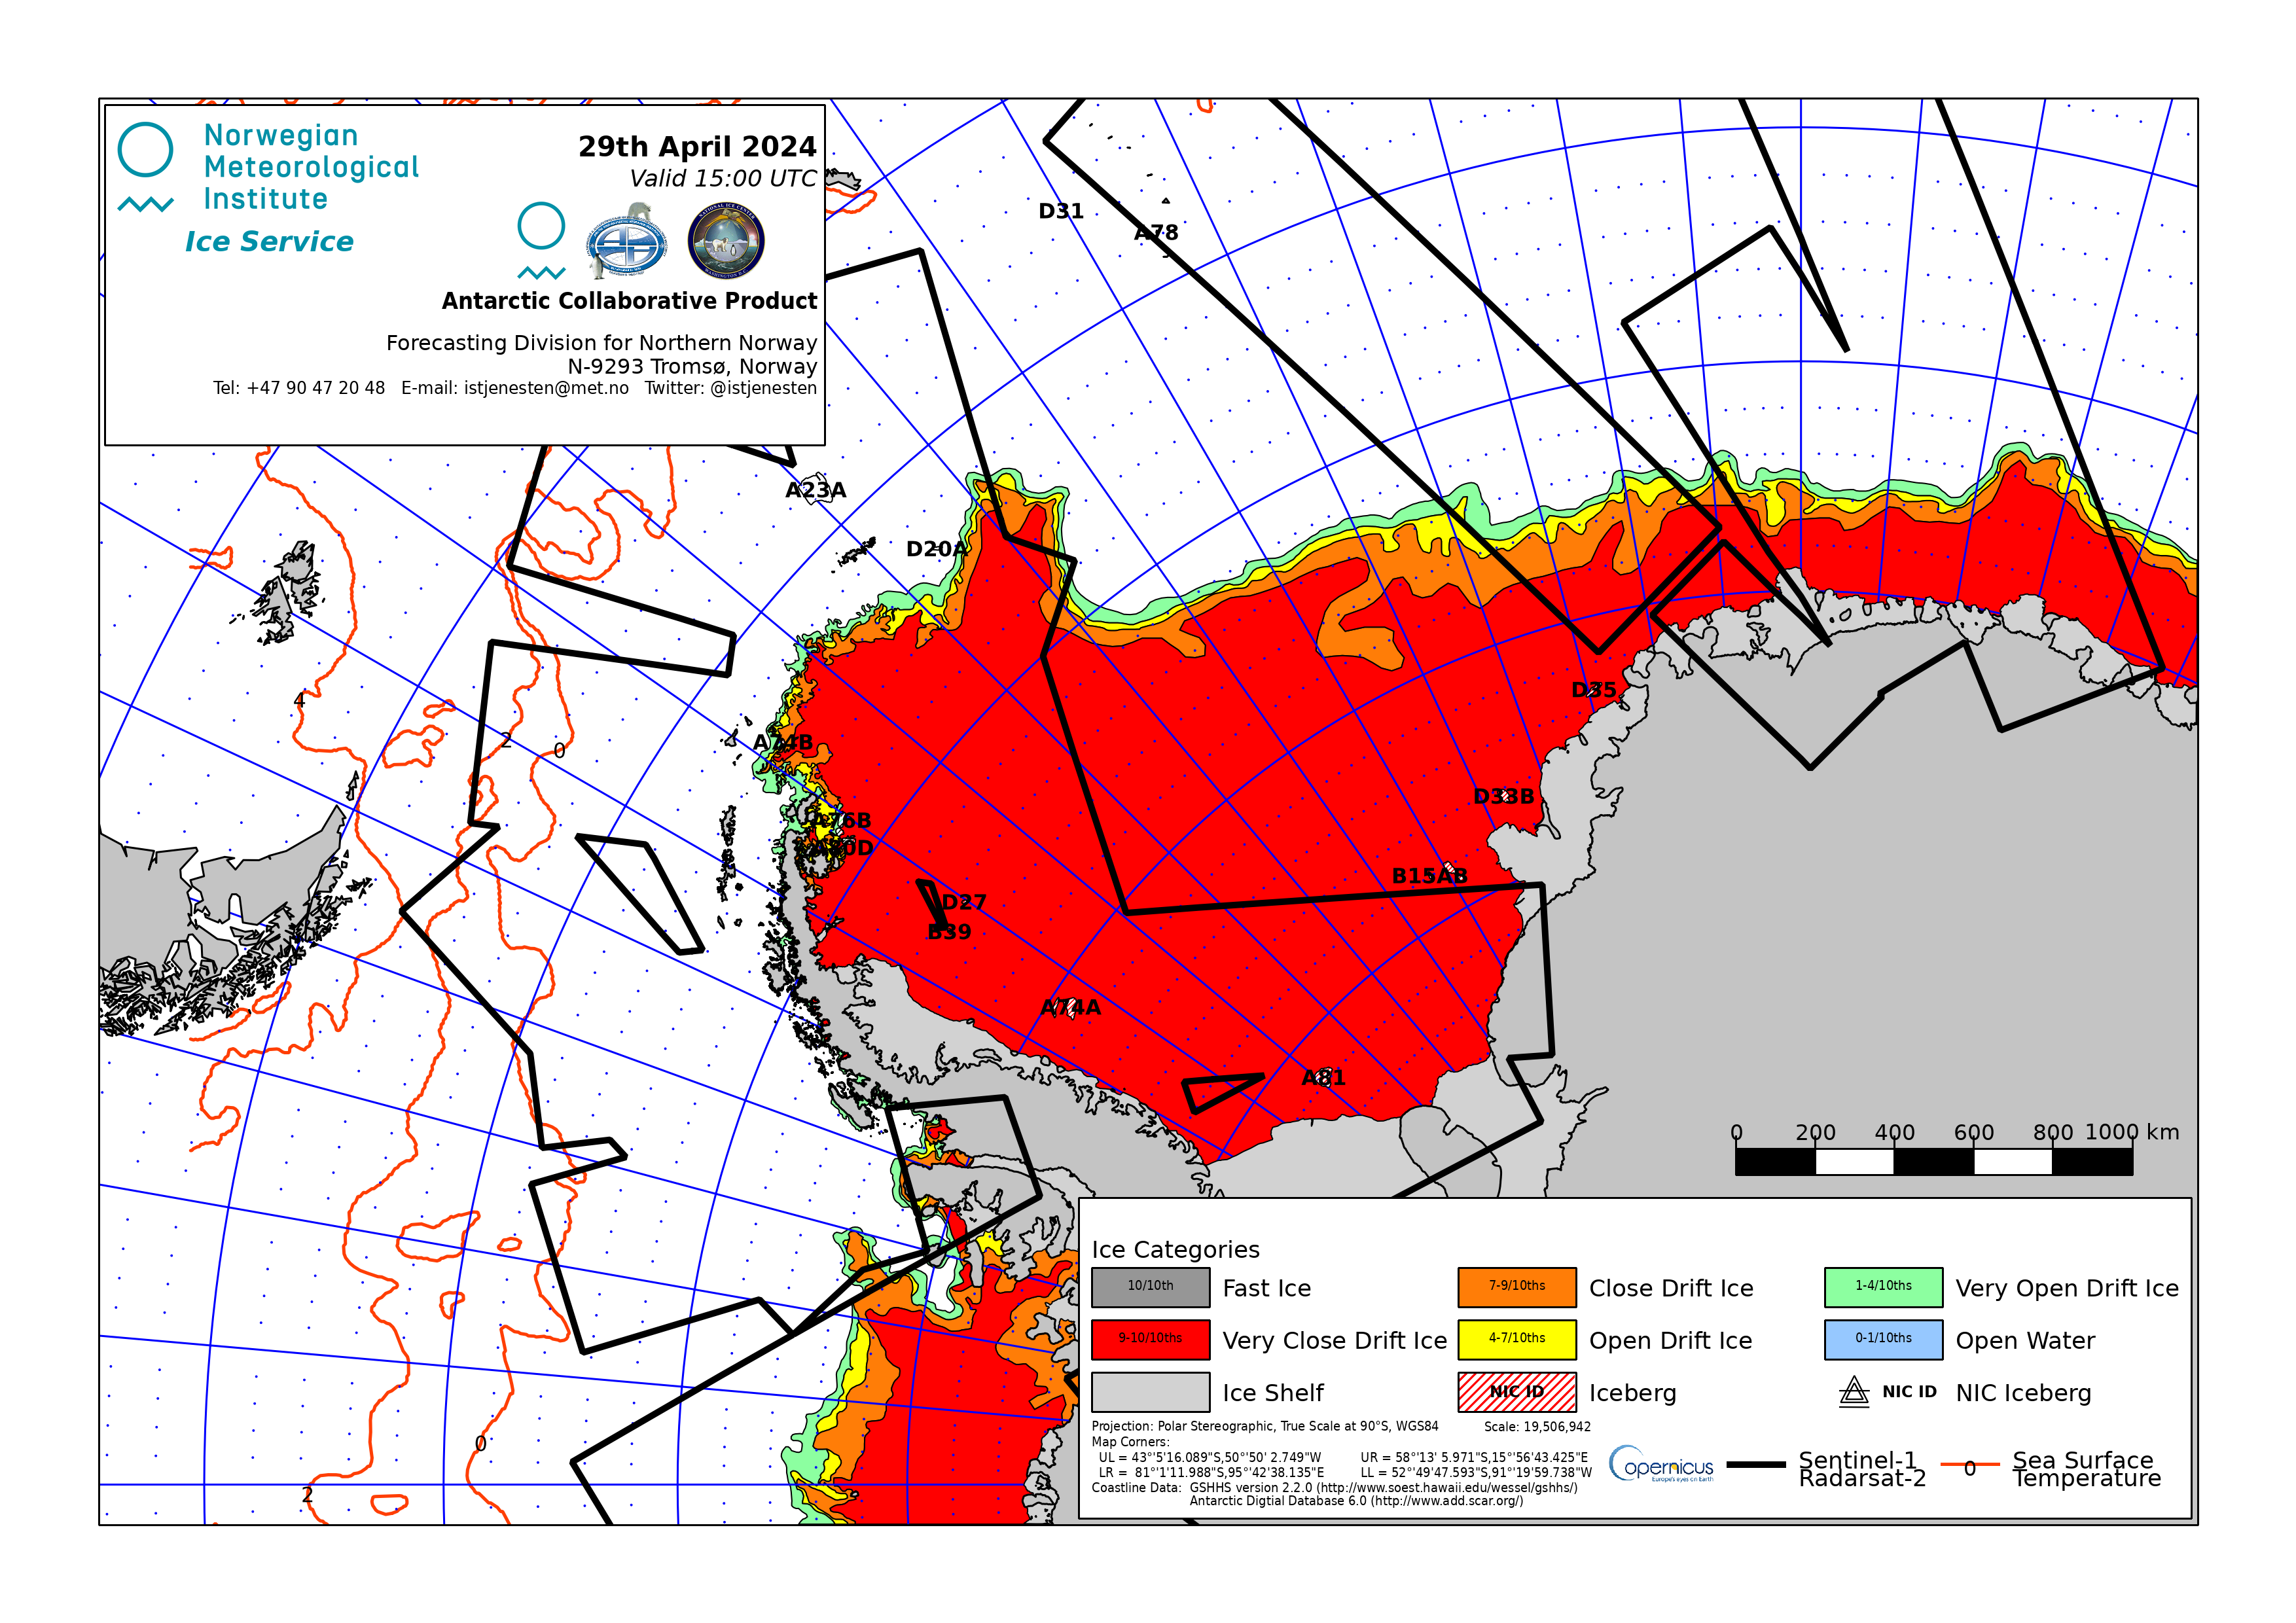
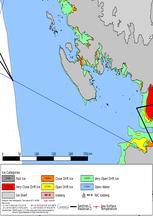
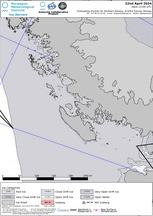
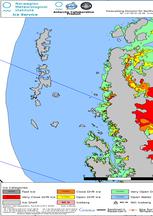
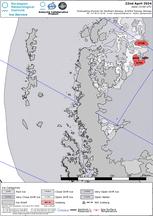
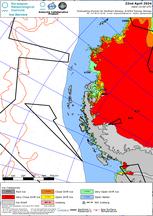
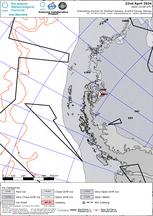
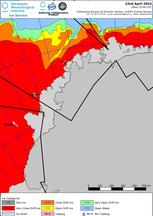
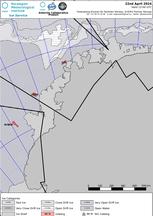
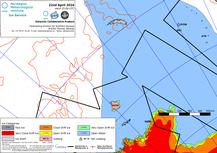
The ice charts are produced by the Norwegian Ice Service as part of their operational responsibility for European waters and in addition as a collaboration for Antarctic waters. These ice charts are analyzed and quality controlled by a Sea Ice Analyst. Current ice charts for European waters are available on weekdays (Monday-Friday) and the Antarctic on Mondays (October-April), both after 1500 UTC.

Updated ice charts can also be found as layers in BarentsWatch - ArcticInfo maps under the theme menu "Ice and Weather". The ice chart is also available in Shapefile format (4 files: SHP, SHX, DBF and PRJ) or zipped Sigrid-3 shapefile (zip) for viewing in GIS-software or via API.

Please find additional ice chart access at: Ice chart access points

Arctic Ice Charts

Latest Arctic ice chart

Arctic ice chart areas


Area Format Hatched
General

Arctic Colour

Arctic Colour PNG

Arctic Colour JPG

Arctic Colour PDF

Arctic Hatched

Arctic Hatched PNG

Arctic Hatched JPG

Arctic Hatched PDF

Baltic

Baltic Colour

Baltic Colour PNG

Baltic Colour JPG

Baltic Colour PDF

Baltic Hatched

Baltic Hatched PNG

Baltic Hatched JPG

Baltic Hatched PDF

Barents

Barents Colour

Barents Colour PNG

Barents Colour JPG

Barents Colour PDF

Barents Hatched

Barents Hatched PNG

Barents Hatched JPG

Barents Hatched PDF

Denmark Strait

Denmark Strait Colour

Denmark Strait Colour PNG

Denmark Strait Colour JPG

Denmark Strait Colour PDF

Denmark Strait Hatched

Denmark Strait Hatched PNG

Denmark Strait Hatched JPG

Denmark Strait Hatched PDF

Fram Strait

Fram Strait Colour

Fram Strait Colour PNG

Fram Strait Colour JPG

Fram Strait Colour PDF

Fram Strait Hatched

Fram Strait Hatched PNG

Fram Strait Hatched JPG

Fram Strait Hatched PDF

Isfjorden

Isfjorden Colour

Isfjorden Colour PNG

Isfjorden Colour JPG

Isfjorden Colour PDF

Isfjorden Hatched

Isfjorden Hatched PNG

Isfjorden Hatched JPG

Isfjorden Hatched PDF

Oslofjord

Oslofjord Colour

Oslofjord Colour PNG

Oslofjord Colour JPG

Oslofjord Colour PDF

Oslofjord Hatched

Oslofjord Hatched PNG

Oslofjord Hatched JPG

Oslofjord Hatched PDF

Svalbard

Svalbard Colour

Svalbard Colour PNG

Svalbard Colour JPG

Svalbard Colour PDF

Svalbard Hatched

Svalbard Hatched PNG

Svalbard Hatched JPG

Svalbard Hatched PDF


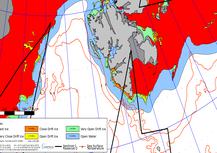
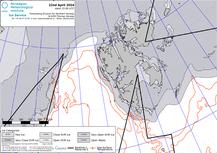
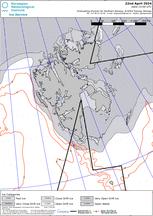
Antarctic Ice Charts

Latest Antarctic chart

Antarctic ice chart areas


Area Colour Hatched
Antarctic

Antarctic Colour

Antarctic Colour PNG

Antarctic Colour JPG

Antarctic Colour PDF

Antarctic Hatched

Antarctic Hatched PNG

Antarctic Hatched JPG

Antarctic Hatched PDF

Adelaide Island

Adelaide Island Colour

Adelaide Island Colour PNG

Adelaide Island Colour JPG

Adelaide Island Colour PDF

Adelaide Island Hatched

Adelaide Island Hatched PNG

Adelaide Island Hatched JPG

Adelaide Island Hatched PDF

Bransfield Strait

Bransfield Strait Colour

Bransfield Strait Colour PNG

Bransfield Strait Colour JPG

Bransfield Strait Colour PDF

Bransfield Strait Hatched

Bransfield Strait Hatched PNG

Bransfield Strait Hatched JPG

Bransfield Strait Hatched PDF

Antarctic Peninsula

Antarctic Peninsula Colour

Antarctic Peninsula Colour PNG

Antarctic Peninsula Colour JPG

Antarctic Peninsula Colour PDF

Antarctic Peninsula Hatched

Antarctic Peninsula Hatched PNG

Antarctic Peninsula Hatched JPG

Antarctic Peninsula Hatched PDF

Weddell Sea - East

Weddell Sea - East Colour

Weddell Sea - East Colour PNG

Weddell Sea - East Colour JPG

Weddell Sea - East Colour PDF

Weddell Sea - East Hatched

Weddell Sea - East Hatched PNG

Weddell Sea - East Hatched JPG

Weddell Sea - East Hatched PDF

South Georgia

South Georgia Colour

South Georgia Colour PNG

South Georgia Colour JPG

South Georgia Colour PDF

South Georgia Hatched

South Georgia Hatched PNG

South Georgia Hatched JPG

South Georgia Hatched PDF


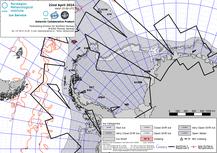
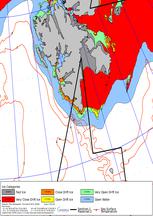
These charts are created between October and April (Austral spring, summer and autumn) as a collaboration project with the U.S. National Ice Center (NIC) and Russian Arctic and Antarctic Research Institute (AARI). An archive is maintained at AARI.