
2020 was the warmest year on record for Norway since the temperature measurements began more than 120 years ago. For Svalbard, although not beating the record from 2016, 2020 was also a warm year with the warmest summer in the 121-year record for Svalbard Airport. Warmer weather also means melting of frozen water. The cryosphere defines places on Earth with frozen water, and includes snow, ice, and permafrost (permanently frozen ground that remains at or below 0 ºC). The Norwegian Meteorological Institute (MET Norway) conducts in-situ measurements and remote sensing observations of the cryosphere: terrestrial snow cover, permafrost and sea ice. What types of cryospheric observations are available on cryo.met.no for the Svalbard area, and what characterized these for 2020?
Terrestrial Snow Cover
Snow depth observations
Snow depth observations are done on a daily basis at many of MET Norway's weather stations, and data is available from seklima.met.no. Plots of the snow depth observations are generated from a selection of these stations and updated daily on cryo.met.no here. Today, the selection of stations contains mainland stations with long-term time series for high-quality observations, and also some stations with shorter times series but of special interest for cryospheric research. Snow depth graphs from weather stations at Svalbard will be made available later this winter/spring. Ny-Ålesund is one of these Svalbard stations, and the snow depth observations at Ny-Ålesund so far this winter are shown in the figure below.

The graph shows this winter's observations (in blue) together with the median and confidence intervals for the period 2009-2020 (in grey). Normally the climatological standard normal period 1991-2020 is used, but for stations established after 1991 a correspondingly shorter reference period is used. Minimum and maximum recorded snow depths are also shown. The snow depth observations in Ny-Ålesund show great daily variability and there is a distinctly different pattern of snow accumulation between the winter seasons. The snow recording from the station clearly illustrates the complexity of snow accumulation on Svalbard. Abrupt changes in snow depth within a few days dominate the series, including strong snow depth decrease events mainly due to wind scouring. These changes seem to be mainly driven by precipitation, wind speed and wind direction, and in some periods, like the end of December 2020, warm spells where snow melt is enhanced by strong wind and high air temperatures.
Snow cover maps
Satellite-based snow cover maps for mainland Norway and Svalbard are generated daily from optical satellite instruments and can be found on cryo.met.no here. The snow cover maps give a spatial overview of where the land is covered with snow, but give no information on the depth of the snow. Reflected sunlight is needed to evaluate the type of surface observed with this type of satellite instrument, and the maps are therefore currently unavailable due to the polar night / low solar elevation. The figure below shows an example of the snow cover map for Svalbard, taken from July 1 2020.
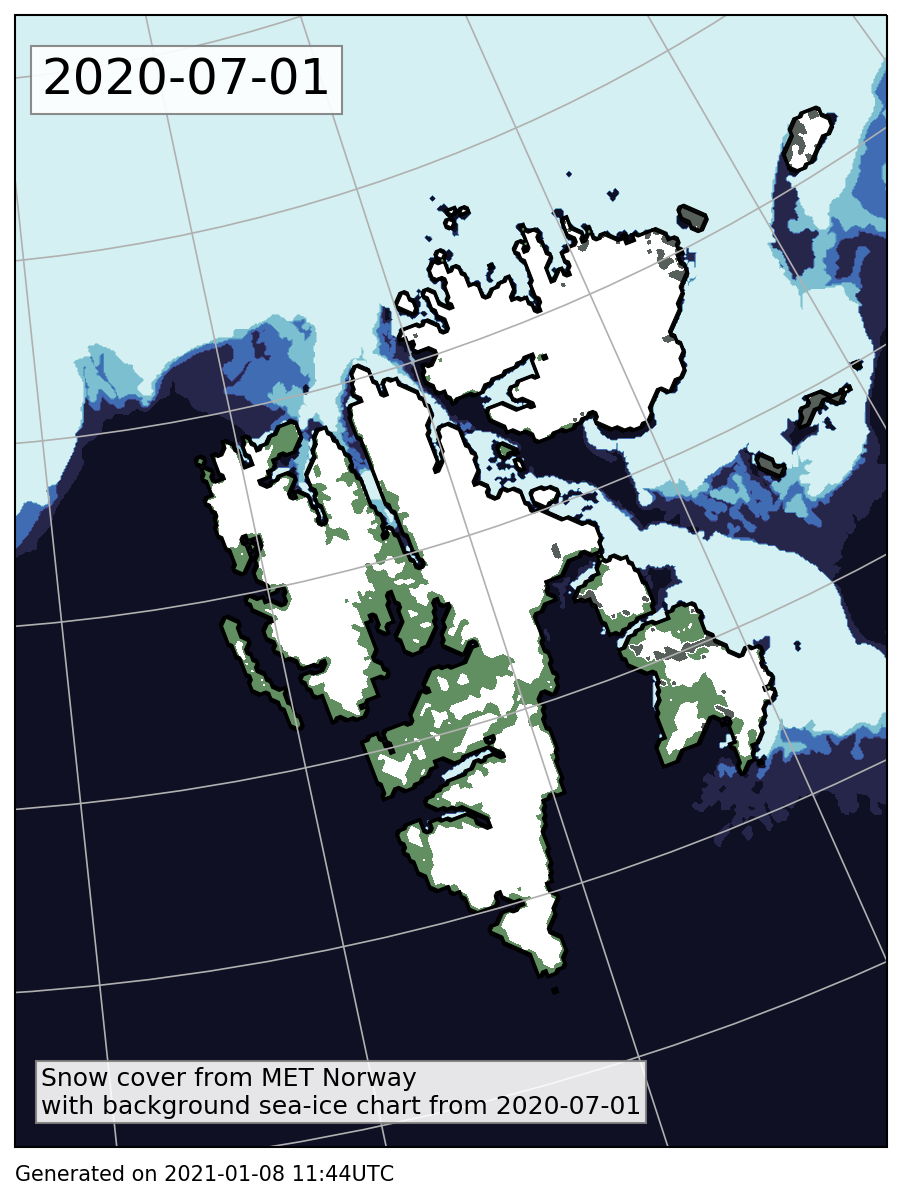
In this figure snow-covered land and glaciers are shown in white, snow-free land in green and ocean in dark blue. Clouds over land are shown in grey, but this day was practically cloud-free. Sea ice from MET Norway’s ice charts has been included as background information and is shown in shades of blue.
Snow cover indices
From the satellite-based snow cover maps, we derive a snow cover index, i.e. a time series giving the ratio of total snow-covered land for a given area. The figure below shows the snow cover index for Svalbard.
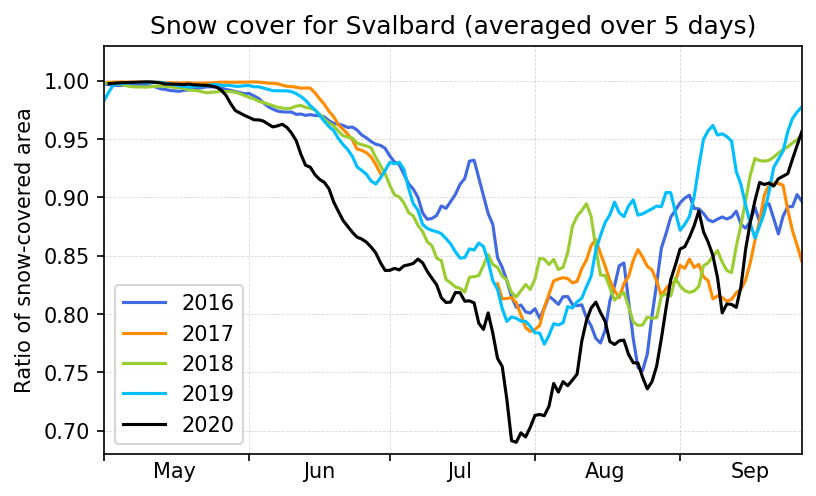
The five most recent years are shown with separate lines. Melting of snow started earlier in 2020 relative to the previous 4 years. A minimum at approximately 70% snow cover appeared in the second half of July in 2020, which was both earlier and significantly lower than for 2016 - 2019. Approximately 60% of Svalbard is covered by glaciers and is included in the snow cover index. The snow cover index for Svalbard is available at this page, and will be updated on a daily basis with 2021 data this spring at the end of the polar night.
Permafrost
MET Norway has recently launched operational permafrost monitoring products on near surface ground temperature and permafrost table temperatures at https://cryo.met.no/en/permafrost.
The monitoring site on Svalbard is located on Janssonhaugen, about 20 km from Longyearbyen. Janssonhaugen was established in 1998 and was one of the first reference stations for permafrost monitoring in Europe. Data from this station provided the first opportunity for temporal trends to be analysed, adding a critical new dimension to current knowledge of permafrost conditions in Svalbard.
So far most of the permafrost monitoring globally is performed manually during fieldwork by researchers and observers. An operational weather station on Janssonhaugen with an extended measurement program was established recently. The collocated monitoring provides researchers and other users with real-time data to study and monitor e.g. effects of warm summers on the permafrost. The data may contribute to early warning systems for natural hazards associated with permafrost.
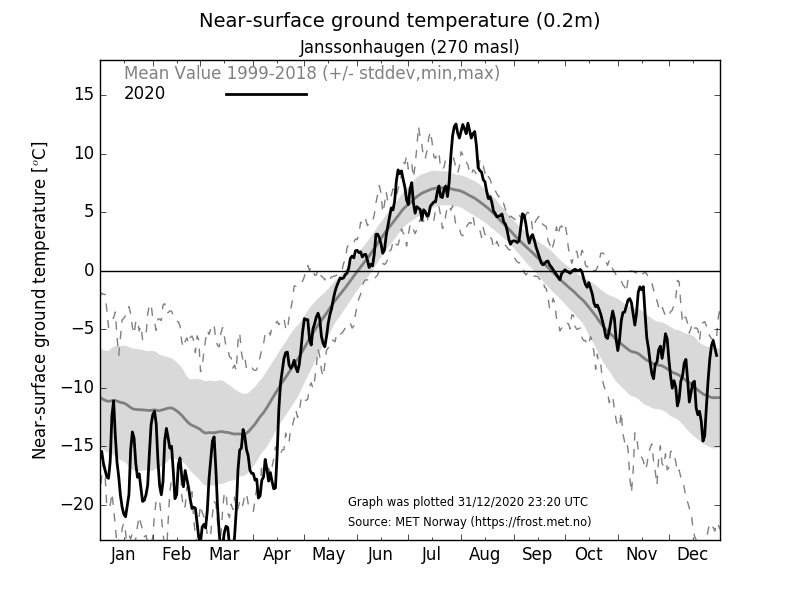
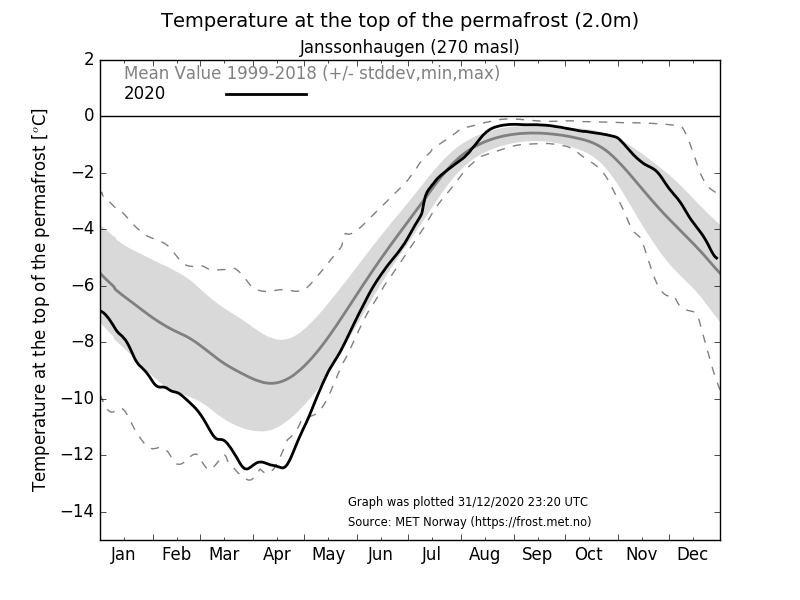
2020 was a year of great temperature variations. The near-ground surface temperatures on Janssonhaugen (figure above) for March - April 2020 was near the lowest for these months in the 21-year record, while August near-surface temperatures in 2020 were ~6-8°C higher than the 1999-2018 August mean, and coincided with unparalleled high air temperatures in the region. The low ground temperatures during the winter contributed to the temperature in the permafrost (figure below) remaining somewhat lower than in recent years, despite record hot summer.
Sea ice
Sea-ice monitoring at MET Norway includes both the navigational ice charts covering the Svalbard and Barents Sea region (updated on weekdays) and the global satellite products as part of the EUMETSAT OSI SAF programme. The global products are updated on a daily basis and cover more than four decades. From these global, daily sea-ice concentration climate data (OSI SAF sea-ice archive), information on the sea-ice conditions around Svalbard (0 – 40°E longitude, 72 – 85°N latitude) is extracted and plotted. The figure below shows the daily sea-ice area index for the Svalbard region in 2020 together with the years 2007 and 2012. The latter two are selected because they represent years that had record low sea-ice extents in September for the Northern Hemisphere (note that from 2021 the year 2007 is replaced by 2020 in these graphs, read more here). In addition, the median sea-ice area, together with percentiles for the 30 years reference period (1981-2010) are shown, as well as the minimum and maximum values for the full record (1979-2020).
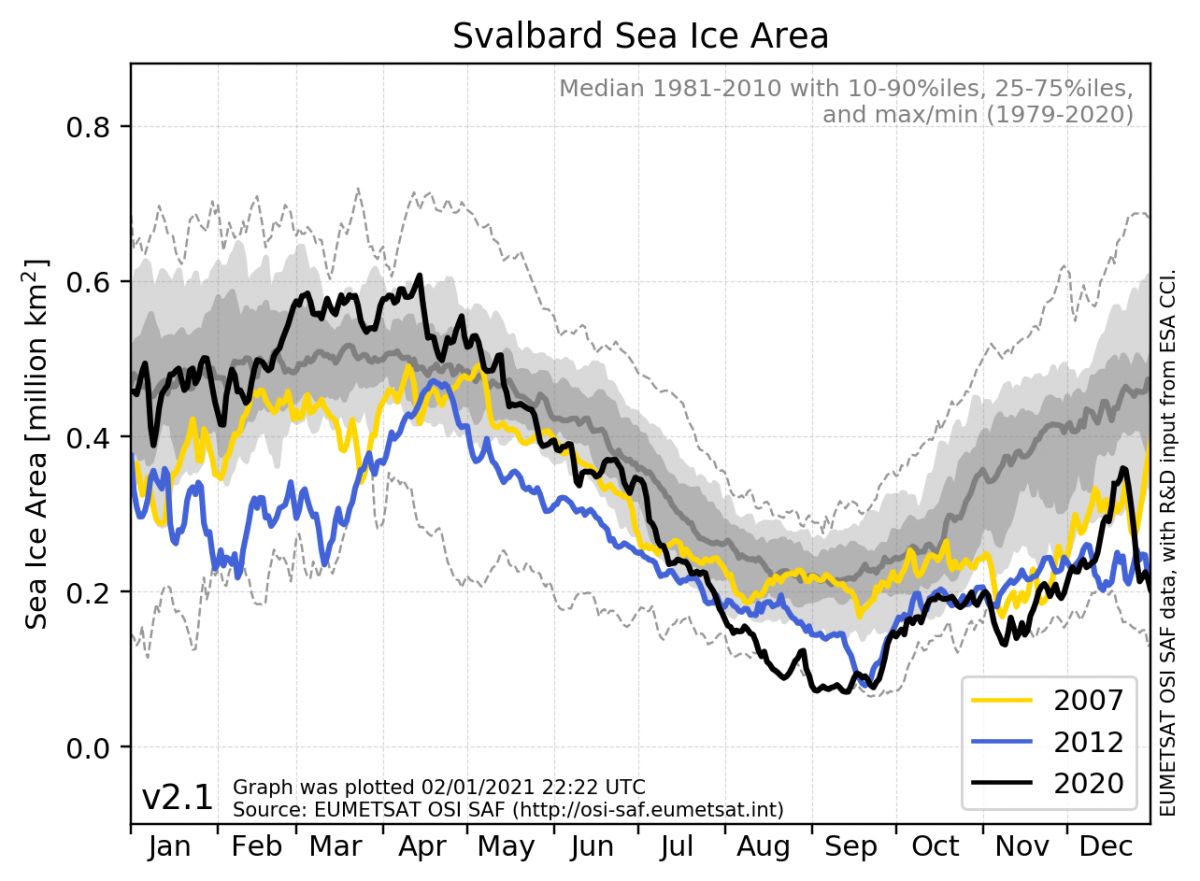
During 2020 the Svalbard sea-ice area has fluctuated from well above the median in March/April to record low values for several days in August/September and November. The very low sea ice values this summer and the slower freeze-up in the region correspond well with the observed very high temperatures in the Arctic regions. The different components of the cryosphere are expected to some extent influence each other, however the relation between them may be complex. High air temperatures above 0 degrees should be reflected in both the sea-ice, the snow-cover and in permafrost measurements. The influence of an ice-covered or ice-free sea on the snow conditions on land may be twofold. While an ice free ocean allows for more direct interaction between the (relatively) warm sea and the cold air, this may both cause snow melting on land, but also it may cause more precipitation in the form of snow on land. Sea ice acts as an insulator and prohibits direct interactions between the atmosphere and the sea. A high occurrence of sea ice around Svalbard during winter can therefore lead to both colder air masses over land which could postpone any melting of snow, and less snow precipitation which could mean an easier snow cover to be melted off during summer.
Some related stories on the Arctic cryosphere in 2020: